- Bitcoin price crushed through crucial support to sink to areas below $32,000
- Appearance of a bullish inside bar candle stick suggest that bulls are seeking to regain control.
Bulls fail to reverse the Bitcoin price losses that began on Sunday, as the bears strive to resume the recent downward momentum from two-week highs of around $36,000 reached on July 4.
Bitcoin bulls appear to be finally giving in to the tween about the platform’s transaction rate and costs by Tesla CEO Elon Musk over the weekend. Musk warned that Bitcoin’s and Ethereum’s transaction rates were “slow” and that the costs were “high”.
At the time of writing, BTC price teeters around $31,890, as it crushed below crucial support at 32,000. Bitcoin price was earlier stuck between $32,700 and $35,600 between July 01 and July 07. Since then, bulls have been latching on a support around the $32,700 area.
Bitcoin Price Shatters Crucial Support On The Way South
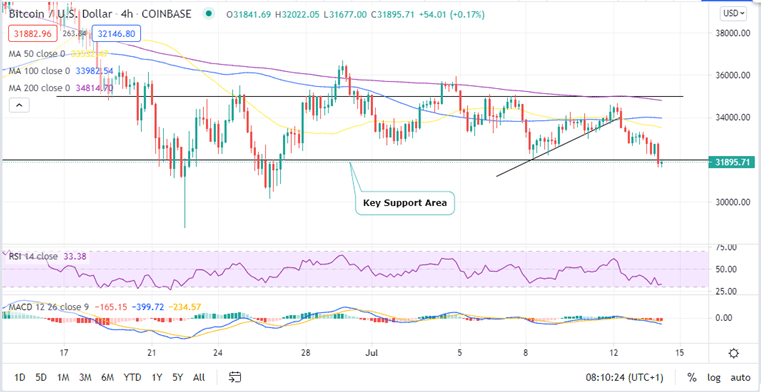
The Bitcoin price four-hour chart shows that the BTC price rose above a powerful resistance around $34,000 where the 50-day and the 100-day Simple Moving Averages (SMA) coincided. The death cross that ensued then saw bulls yield into this resistance as Bitcoin price started the journey downwards.
A death-cross is an important bearish signal that occurs when a short-term SMA crosses below a longer-term SMA. When the 50-day SMA crossed below the 100-day SMA on July 12, BTC price has been on a downward trend. This has seen the bellwether cryptocurrency shed approximately 7.6% off its high of around $3,460 on July 12 to levels below $32,000.
Despite this, Bitcoin still remains among the best cryptocurrency to buy in 2021 if the price will remain above $32,000.
Note that a four-hourly closure above this level could offer the much-needed oomph to motivate the Bitcoin bulls, opening the gates upwards to reclaim major support at $32,700. The bullish potential is accentuated by the appearance of the inside bar candlestick at the end of the chart. This is an indication that bulls might be gearing to take control of the market and attempt to push the Bitcoin price upwards.
Bitcoin Price (BTC/USD) Four-Hour Chart
Looking Over The Fence
On the downside, the down-ward slopping 50-day SMA could guard any attempts to push the price upwards. As such, the recent bearish run might continue in the near time. This is bearish outlook is validated by the by the Relative Strength Index (RSI), which is currently at 33.40 close to the oversold region. This is even further accentuated by the Moving Average Convergence Divergence (MACD) indicator since the which is currently below the signal line in the negative zone.
Please note that a continued move downwards will take the Bitcoin price towards the June 26 low at $30,000.
If you are seeking to buy Bitcoin, our guide on how to buy cryptocurrency might be very useful.
Looking to buy or trade Bitcoin now? Invest at eToro!
Capital at risk
