- Bitcoin price is trading in the red, down some 1.45% in the second half of the session.
- BTC/USD resistance is observed at 10 and 11 November high area, preventing $9000 breakthrough for now.
- The bulls are edging closer towards a break into the $9000 price territory.
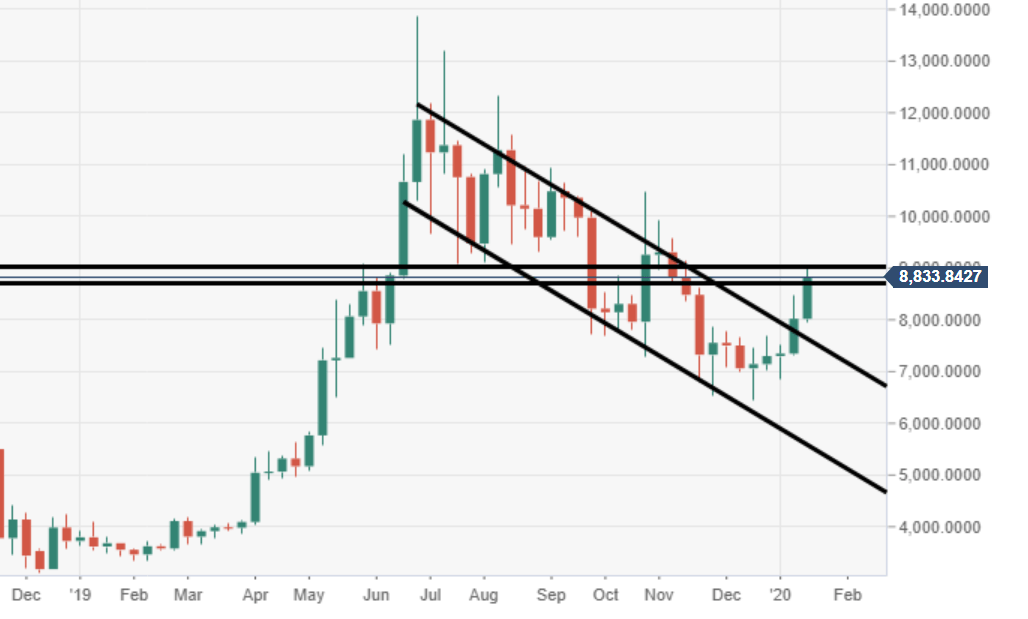
BTC/USD weekly chart
The price is running towards its fifth consecutive week in the green, following a strong flag breakout.
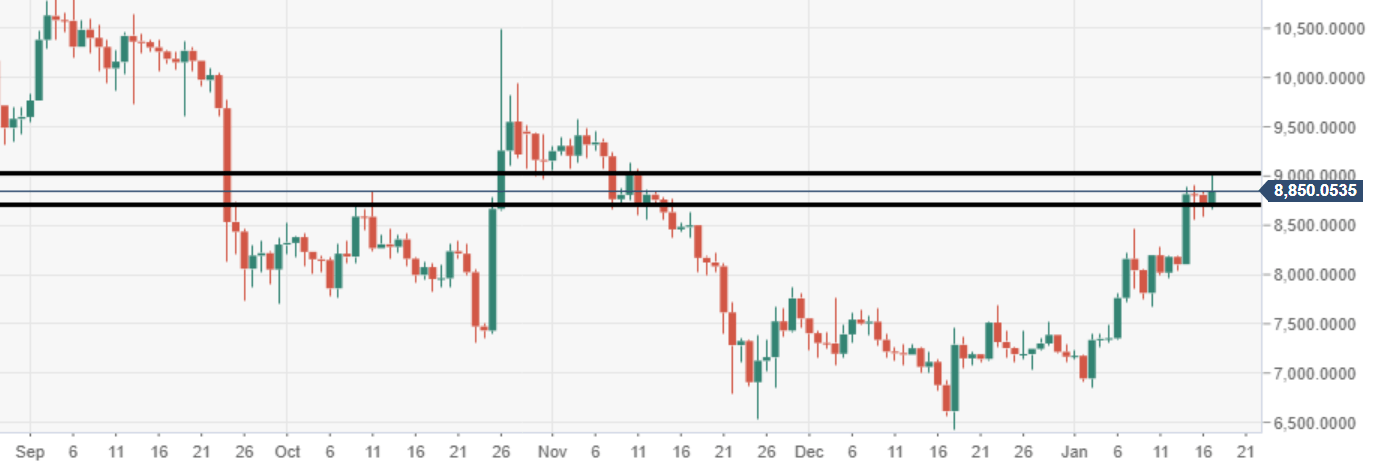
BTC/USD daily chart
Price action has formed decent support at $8700, daily support, which is critical for Bitcoin’s next attempt at breaking $9000.
Spot rate: 8845.27
Relative change: +1.50%
High: 8848.81
Low: 8665.27
