- BTC/USD has barely moved after a sharp collapse on Tuesday.
- The initial resistance is created by $9,600 and followed by $10,000.
BTC/USD attempted a recovery above $9,600 only to slide back to $9,550 by press time. The first digital coin has been moving in a tight range after wild gyrations during the first two days of the week. BTC/USD has lost over 5% in the recent 24 hours; however, it is mostly unchanged since the start of the day. Bitcoin’s market value is registered at $176 billion, while its market share decreased to 65%.
The intraday chart shows that the RSI stays flat in the neutral territory. It means that the coin may stay in the current range limited by $9,400 on the downside and $9,600 on the upside.
BTC/USD 1-hour chart
-637267801224155613.png)
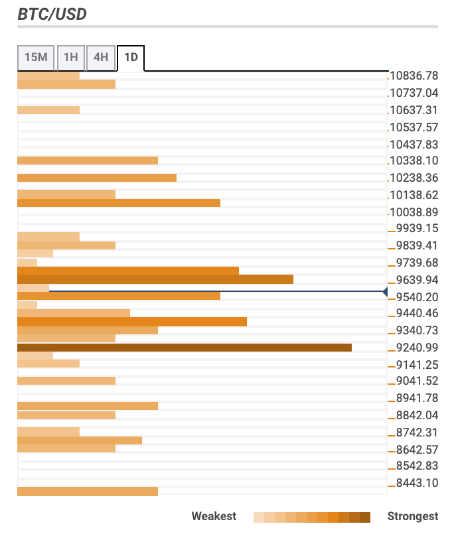
Let’s have a closer look at support and resistance levels clustered around the current price.
Resistance levels
$9,600 – 23.6% Fibo retracement daily, 1-hour SMA100, the highest level of the previous week.
$10,000 – Pivot Point 1-day Resistance 1, the highest level of the previous month
$10,200 – Pivot Point 1-week Resistance 1, the highest level of the previous day
Support levels
$9,400 – Pivot Point 1-day Resistance 1, the highest level of the previous day, daily SMA10
$9,300 – 38.2% Fibo retracement weekly
$9,000 – 61.8% Fibo retracement weekly.