- Bitcoin price is trading in negative territory, down 1.70% in the second half of the session.
- BTC/USD is moving within consolidation mode, ahead of further potential moves south.
- Critical daily support should be noted around the $9500 price area.
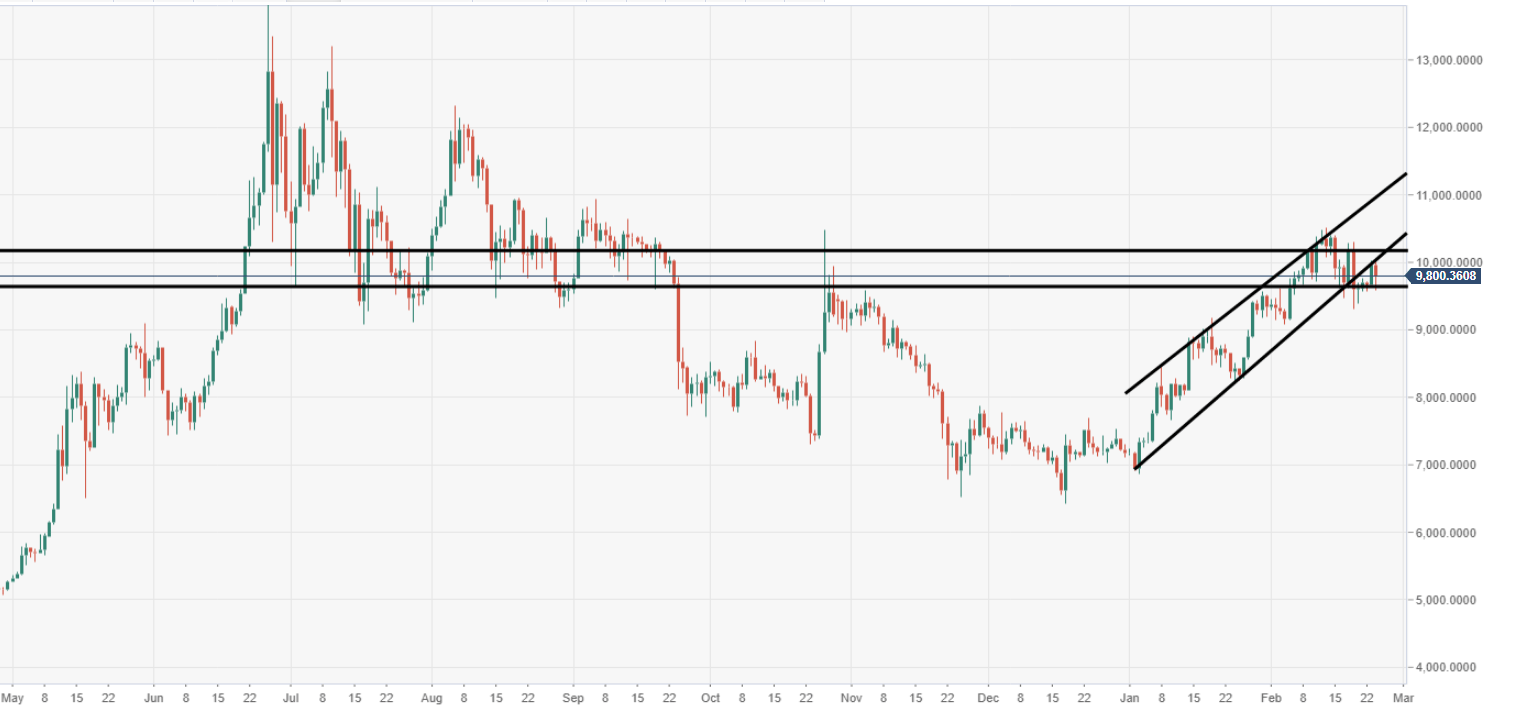
BTC/USD weekly chart
The price closed in the red last week, which has left the door open to further potential selling, following the evening star formation.
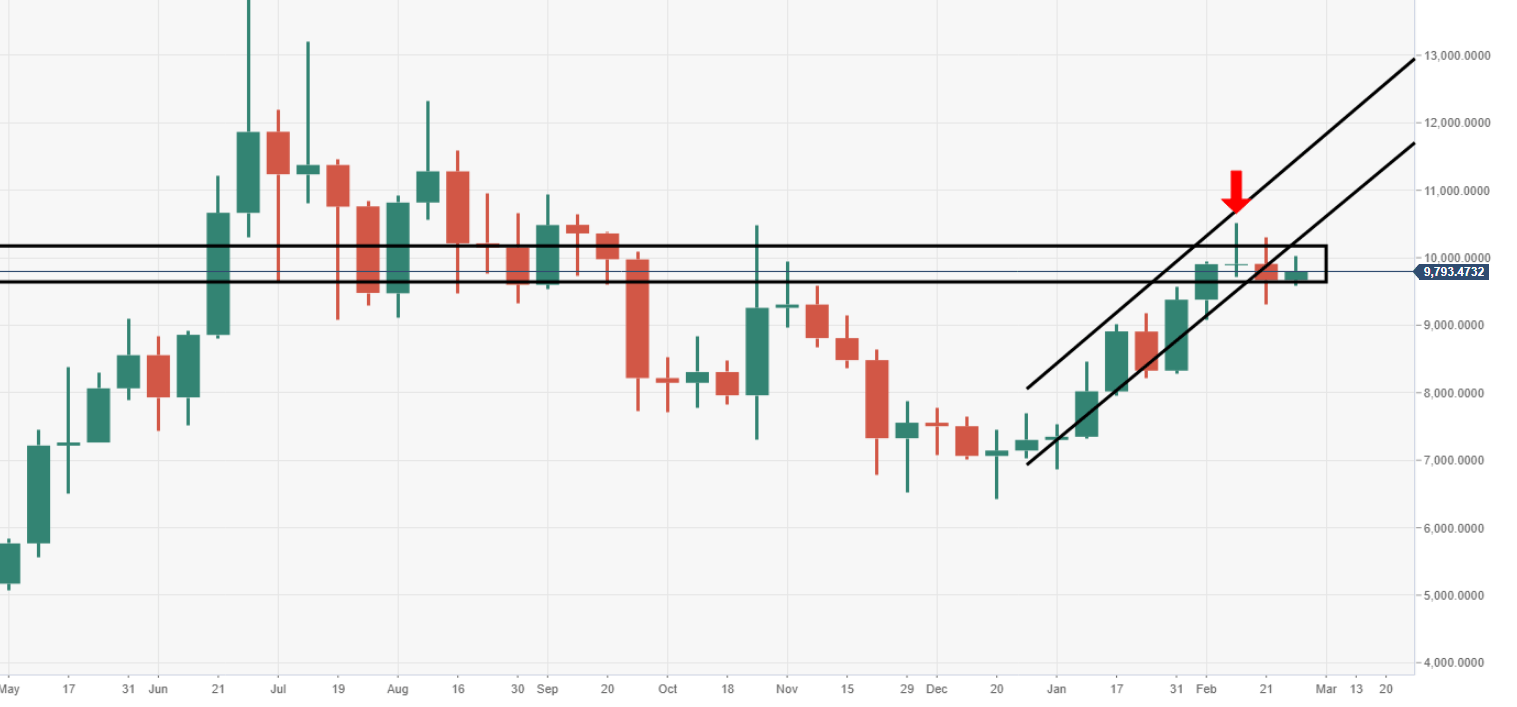
BTC/USD daily chart
Price action via the daily chart view has broken and retested a critical ascending trend line, rejection has been observed.
Spot rate: 9,806.10
Relative change: -1.70%
High: 10,027.49
Low: 9591.27
