- BTC/USD staged a nice recovery above the psychological $9,000.
- The further upside is limited by the next resistance of $9,300.
BTC/USD is changing hands at $9,150 amid short-term bullish bias with shrinking volatility. The sustainable move above $9,000 improved the short-term technical picture, though $9,300 still blocks the way and separates BTC bulls from a sustainable recovery. BTC/USD has gained over 3.5% in recent 24 hours, while its market share increased to 65.9%
The intraday chart shows that the RSI stays flat in the overbought territory. It means that the coin may retreat to $9,000 before another growth attempt.
BTC/USD 1-hour chart
-637261841681509175.png)
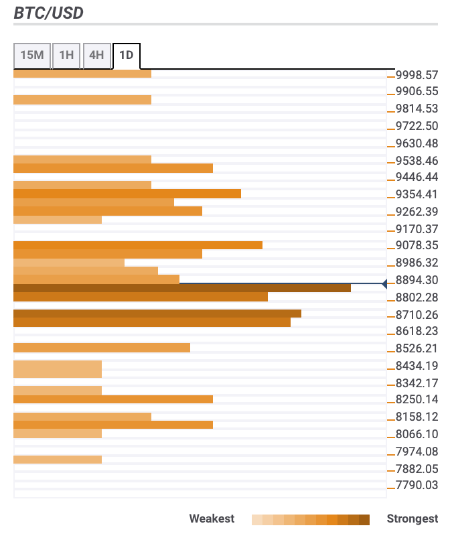
Let’s have a closer look at support and resistance levels clustered around the current price.
Resistance levels
$9,300 –4-hour SMA100, 38.2% Fibo retracement weekly, the middle line of the daily Bollinger Band
$9,500 – 61.8% Fibo retracement weekly
$10,000 – Pivot Point 1-month Resistance 1
Support levels
$9,000 – Pivot Point 1-day Resistance 1, the highest level of the previous day
$8,900 – the middle line of the 4-hour Bollinger Band, the middle line of the 1-hour Bollinger Band, 61.8% Fibo retracement daily
$8,700 – 23.6% Fibo retracement monthly, the lowest level of the previous day.