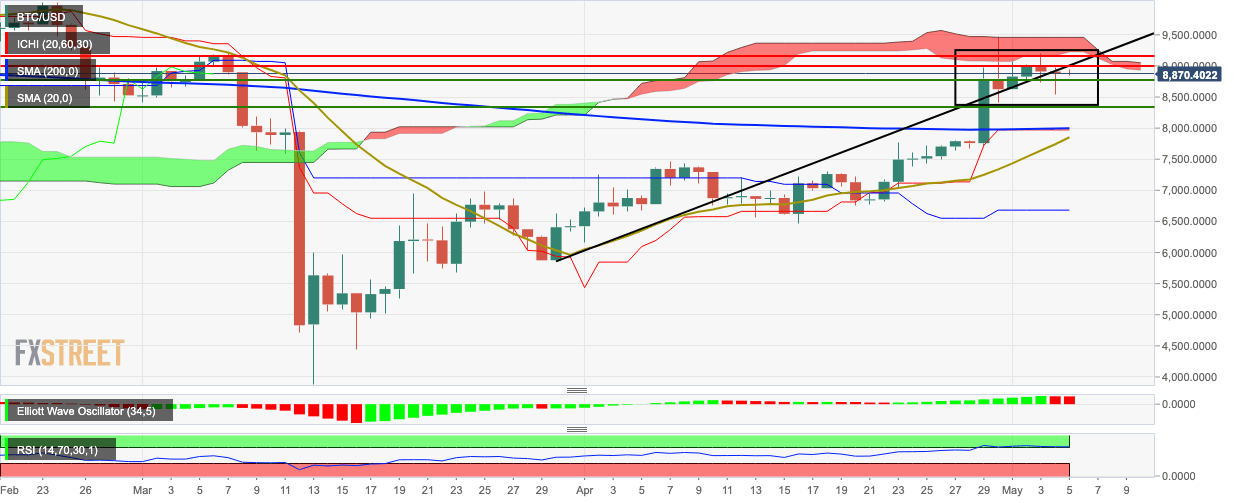
- The RSI indicator is trending at the edge of the overbought zone.
- The Elliott Oscillator has had two straight red sessions, following 11 consecutive green sessions.
BTC/USD daily chart
BTC/USD bears remained in control for the third straight day as the price dropped from $8,886 to $8,864. This Monday, the price broke below the upward trending line and it has moved horizontally since then. The daily BTC/USD price is consolidating below the red Ichimoku cloud. The SMA 20 is about to cross over the SMA 200, to potentially chart a bullish cross. The Elliott Oscillator has had two red sessions following 11 consecutive green sessions. The RSI indicator is trending at the edge of the overbought zone, which means that more bearish correction may be around the corner.
BTC/USD hourly chart
The hourly BTC/USD chart shows a tug of war between bulls and bears. The price had dipped from $8,911.30, all the way down to $8,620. The buyers then found some much-needed support and broke past key levels at $8,703 and $8,842.35. The bulls eventually ran out of momentum at the $8,959.35 resistance level and dropped down.
Key levels

-637242392926589128.png)
