- The MACD in the daily chart indicates decreasing bullish momentum.
- The one-hour BTC/USD chart shows early bearish dominance, followed by a comeback from the bulls.
BTC/USD daily chart
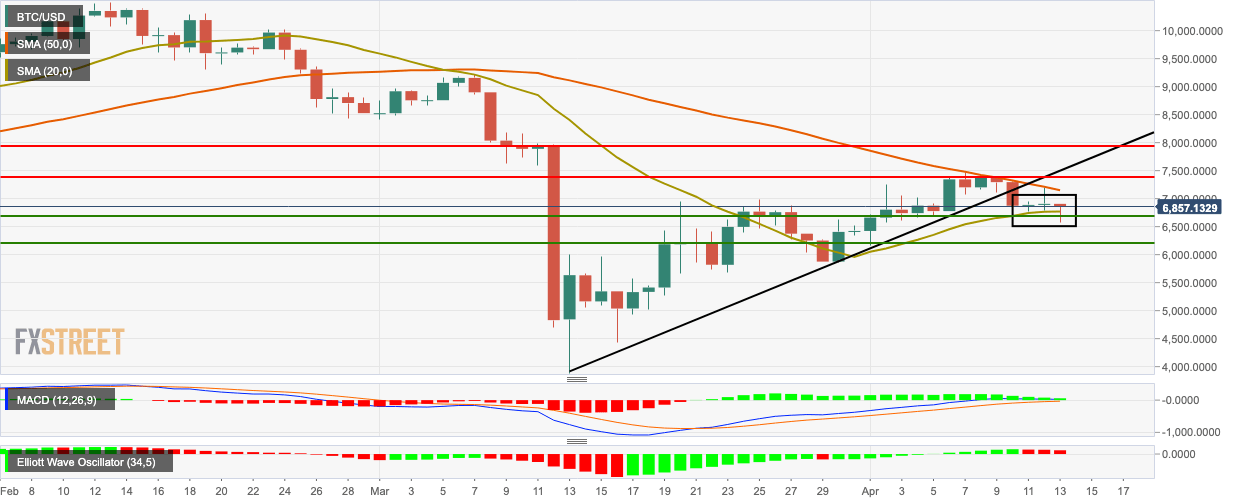
BTC/USD continued to consolidate below the $7,000 level as the bears managed to drop the price from $6,906.90 to $6,874. The bears need to break below the $6,694.15 support level to continue the downward momentum. The MACD indicates decreasing bullish momentum, while the Elliott Oscillator has had three straight red sessions showing overall bearish sentiment.
BTC/USD one-hour chart
-637224164923633946.png)
The hourly BTC/USD chart makes for some pretty interesting reading. The bears started the session strongly, with BTC/USD falling from $6,908.2 to $6,696.35 in two hours. Following that, the price trended horizontally for a bit before the bulls regained control and took the price up from $6,628.88 to $6,887.30 in 10 hours. In the process, the hourly price has broken above the SMA 50 curve and the 20-day Bollinger Band, indicating that the asset is overvalued in the hourly timeframe. This means that another bearish correction may be around the corner. The 20-day Bollinger jaw has widened, showing increasing market volatility, while the RSI indicator is trending horizontally around 59.25.
Key levels
