- Bear pressure mauled through $9,400 support before forming a low around $9,300.
- BTC/USD is dancing above $9,400 with the upside currently limited by the 50 SMA.
Bitcoin struggled to secure key support areas during the weekend sessions. However, bearish pressure had its way smashing the price back under $10,000. Downside correction continued below the moving average. Besides, expected support at the 61.8% fib retracement level taken between the last drop from $10,226 to a low of $9,126 caved in.
The declines ravaged through other key levels at $9,800and $9,600. The pressure mauled through $9,400 support before forming a low around $9,300. Although forced between a rock and a hard place, the buyers managed to give Bitcoin an incredible push above $9,600. While the price infiltrated the resistance at the 50% Fib level, it failed to break above the 100 Simple Moving Average (SMA) 1-hour resistance.
Also read: Crypto mining gets legalized by the Iranian government
The compelling move from the support at $9,300 formed a bullish flag pattern as observed on the chart. The reaction to the pattern has resulted in a shallow breakdown towards the 23.6% Fib level support close to $9,400.
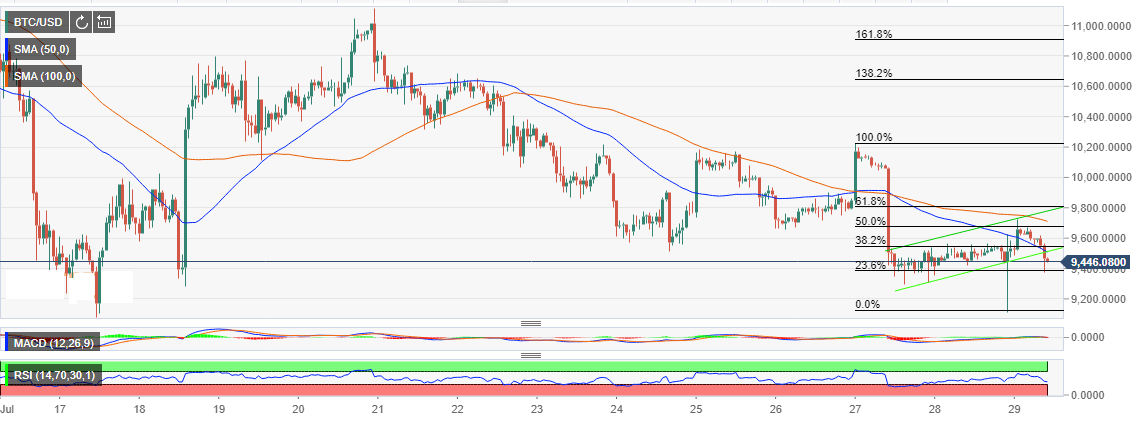
Meanwhile, BTC/USD is dancing at $9,468 with the upside currently limited by the 50 SMA 1-hour. Bitcoin’s technical picture shows the bulls having the upper hand despite the correction witnessed today. The Relative Strength Index (RSI) show BTC is trading slightly above oversold levels. Therefore, a little push could relaunch BTC towards $10,000 and propel to the ultimate $14,000 level. For now, staying above $9,400 to essential to ensure that the downside is protected as the buyers glance towards $10,000.
BTC/USD 1-hour chart