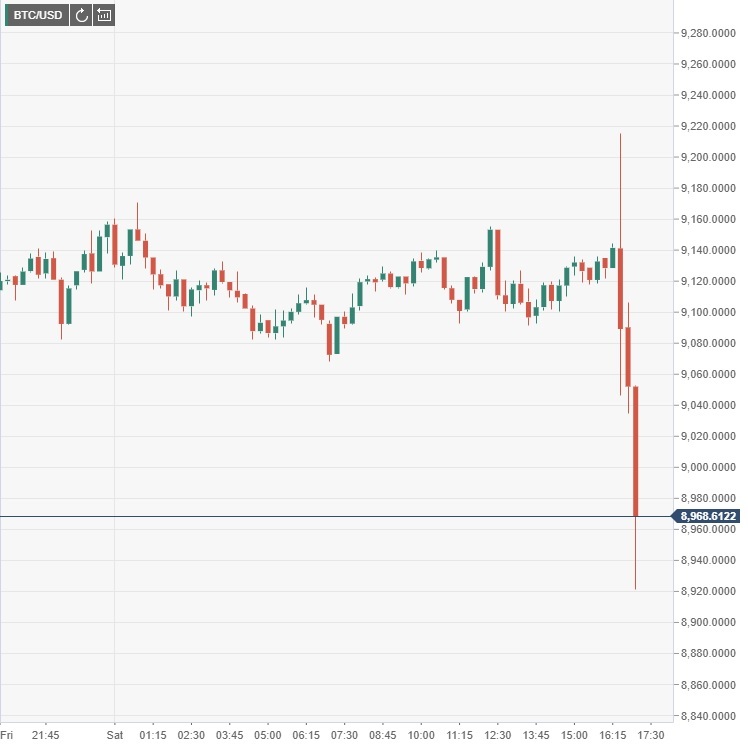
After climbing to a fresh daily high of $9,215 in the last hour, Bitcoin (BTC/USD) made a sharp U-turn and quickly erased all of its daily gains. As of writing, the pair was trading at $8,960, losing 2.15% on a daily basis.
Although there were no apparent catalysts behind this sharp drop, the fact that the pair failed to break above the 20-day SMA and slumped below the key Fibonacci support may have allowed sellers to take control of the price action.
BTC/USD 15-min chart
 Technical outlook
 Technical outlook
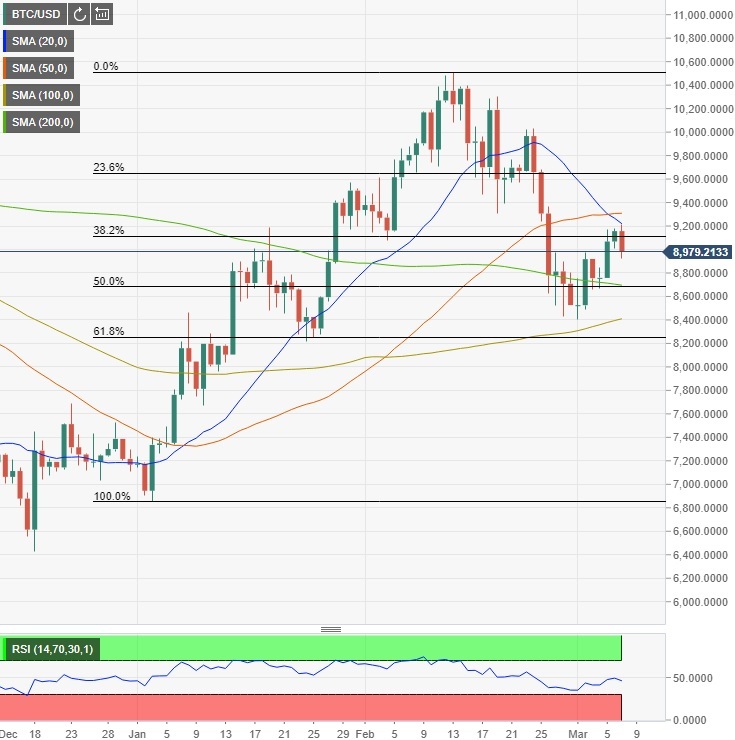
With this recent fall, the RSI indicator on the daily chart turned south below the 50 handle to suggest that the bearish momentum is building up. The next critical support for the pair aligns at $8,700 (200-day SMA/Fibonacci 50% retracement of January-mid-February rally) before $8,400 (March 1 low/100-day SMA).
On the upside, $9,100-$9,200 area (Fibonacci 38.2% retracement of the same rally/20-day SMA/daily high) is located as the initial hurdle ahead of $9,300 (50-day SMA).
BTC/USD daily chart