- Bitcoin is trading within the confines of a contracting triangle, pending breakout.
- Both the 50 SMA and the 100 SMA are working as immediate support lines above the 61.8% support.
Bitcoin price is trading at the narrow end of a short-term contracting triangle, likely to culminate in another breakout to the upside. After coming short of the critical resistance at $8,500, BTC/USD has been correcting lower while the upside movements being limited by the bearish trendline.
The 61.8% Fib retracement level between the highs of $8,479.97 and a low of $7,702.22 has been very instrumental holding ground on Thursday. The trend is neither bullish or bearish and the price is a sitting duck waiting for either the bulls or the sellers to attack. BTC/USD has proven to the cryptocurrency community that it has the potential to recover in spite of the bull rally losing momentum.
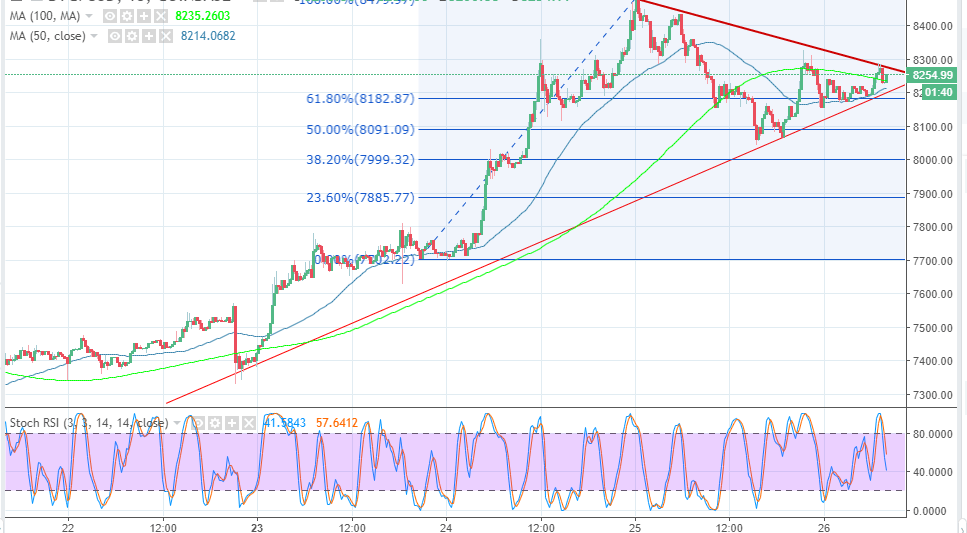
The next resistance target for the intraday trading is $8,300, however, the resistance at $8,275 must be overcome in the short-term. Moreover, $8,400 is a critical breakout zone for the retracement to levels beyond $8,500. On the downside, both the moving averages on the 15-minutes chart are working as support lines: The 100 SMA at $8,239.57 while the 50 SMA positioned a little lower at $8,212.68. As mentioned the 61.8% Fibo is working as a strong intraday support at $8,182.81 but if declines exceed this level, $8,100 will stop the break down to $8,000.
BTC/USD 15-minutes chart