- Bitcoin closed with modest gains below $12,000 on Saturday.
- BTC/USD remains on track to end week in positive territory.
- $12,325 aligns as the next target on the upside.
Bitcoin (BTC/USD) tested $12,000 on Saturday but failed to gather enough momentum to break above that critical level and closed with a daily gain of 0.7% at $11,688. With the trading action remain subdued on Sunday, BTC/USD stays unchanged on a daily basis. Nevertheless, the pair remains on track to close the fourth straight week in the positive territory.
Bitcoin technical outlook
Saturday’s movements left BTC/USD near-term outlook unchanged. The Relative Strength Index (RSI) on the daily chart continues to hover a little below the overbought threshold. Additionally, price continues to fluctuate between the 12-month-high it set $12,135 in early August and the Fibonacci 23.6% retracement of the latest upsurge.
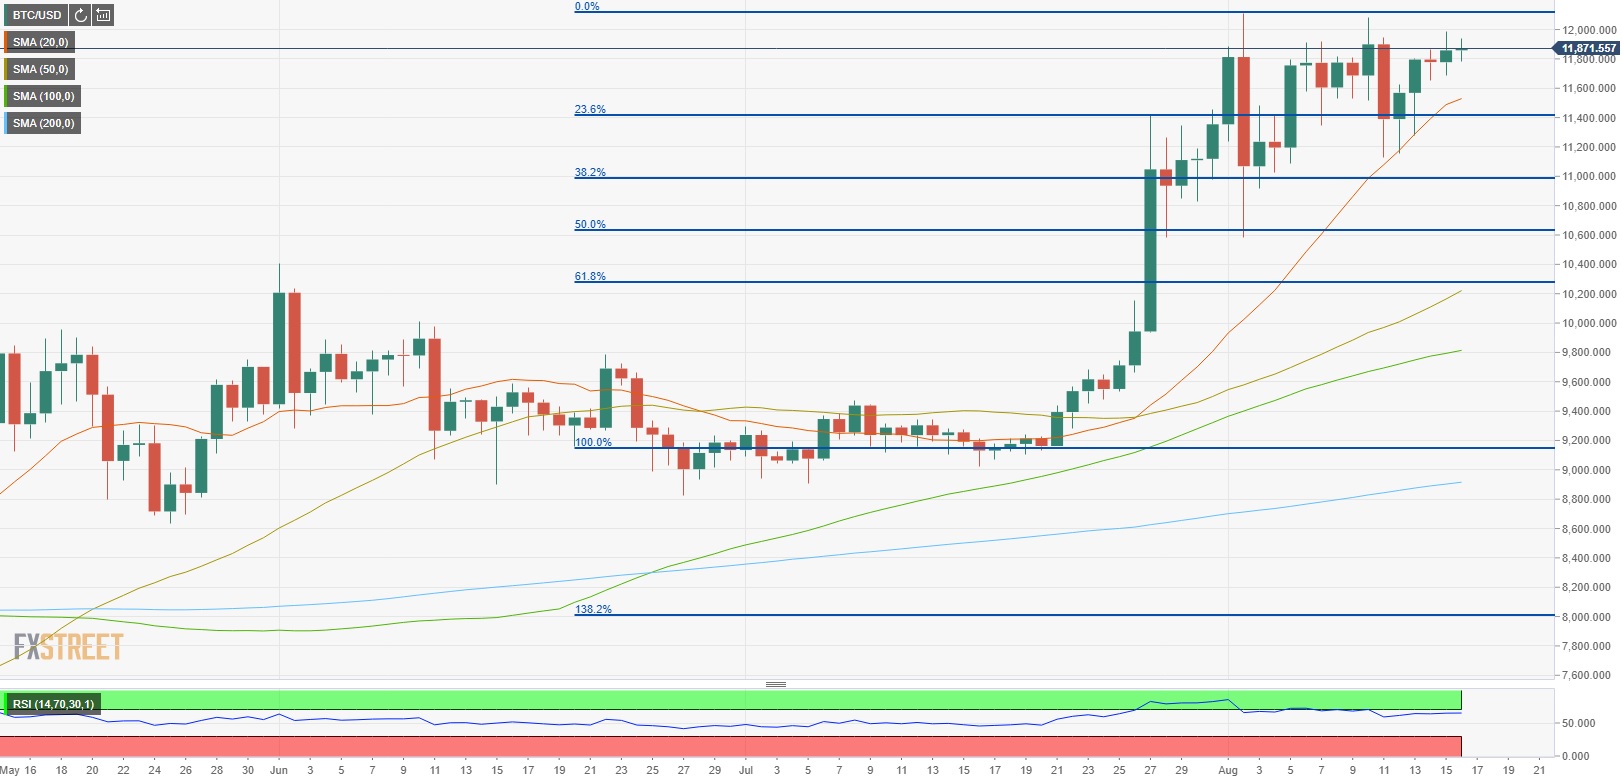
If the pair manages to renew its highest level since August of 2019 above $12,135, it could target $12,325 (August 6, 2019, high) could and $13,195 (July 10, 2019, high). On the downside, $11,700 (August 15 low), $11,500 (20-day SMA) and $11,000 (lower limit of the two-week-old range, Fibonacci 23.6% retracement of July 24 – August 2 rally).
Bitcoin chart (daily)