- Bitcoin remains on track to post weekly gains.
- Price seems to have steadied between key Fibonacci retracement levels.
Bitcoin (BTC/USD) added around 2% on Saturday and closed at $6,8775 but erased the majority of its gains on Sunday. As of writing, the pair was trading at $6,782, down 1.35% on a daily basis. At the current level, the pair is up 15% on a weekly basis and remains on track to close the third straight week in the positive territory.
Technical outlook
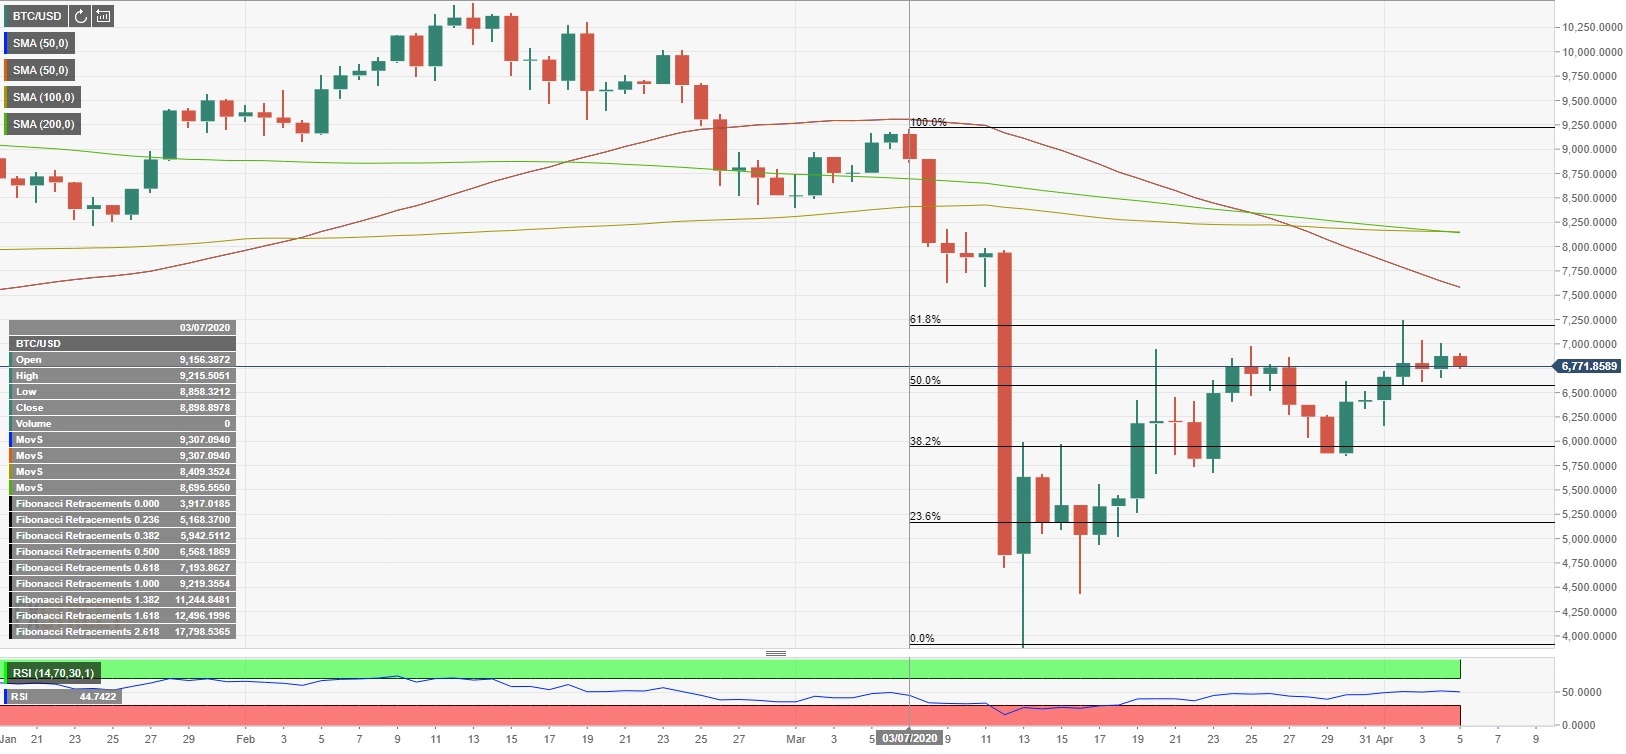
On Thursday, the pair rose to its highest level in three weeks at $7,250 but lost its traction as the buying pressure started to fade away near the 61.8% Fibonacci retracement of the sharp drop at $7,250. With a decisive break above that level, the pair could target $7,650 (50-day SMA) and $8,170 (100-day SMA/200-day SMA).
On the downside, supports could be seen at $6,600, (Fibonacci 50% retracement), $6,350 (20-day SMA) and $6,000 (Fibonacci 38.2% retracement/psychological level).
Meanwhile, the RSI indicator on the daily chart continues to move sideways near the 50 handle to suggest that the price action is likely to remain neutral in the near-term.
BTC/USD daily chart