- BTC/USD is hovering at $5,600, off the intraday low.
- A strong growth above $5,700 is needed for an extended recovery.
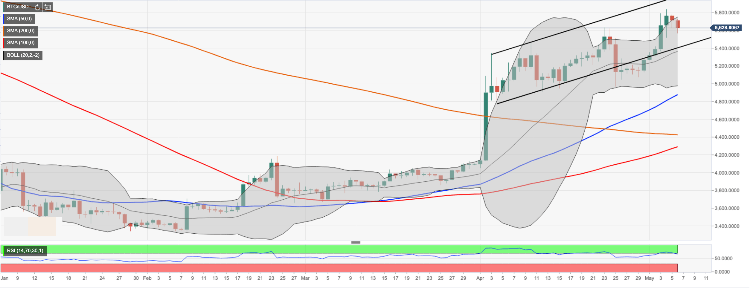
BItcoin (BTC) hit $5,839 high on Saturday only to slip back to $5,569 on Monday. While the first digital coin managed to reclaim $5,600 handle, it is still vulnerable to the further downside correction as the daily RSI (the Relative Strength Index) points has reverted from an overbought territory and points downwards.
From the long-term point of view, the recent correction does not negate a bullish case as BTC/USD is moving within an upside channel. Basically, the sell-off qualifies as a healthy correction as long as the price stays above $5,400-$5,385 area (the lower line of the above-said channel and the midline of a daily Bollinger Band).
On the intraday charts, $5,600 serves as a good local support created by SMA100 (1-hour). Once it is cleared, the sell-off may be extended towards the Asian low of $5,569 and to psychological $5,500 with May,4 low on approach. The next barrier is created by the channel support.
On the upside, the immediate recovery is capped by a confluence of SMA50 (1-hour) and a midline of 1-hour Bollinger Band at $5,700. We will need to see a strong move above this barrier for the recovery to gain traction with the next aim at Sunday’s high of $5,839.
BTC/USD, 1-day chart