- Bitcoin price is trading in negative territory, down 0.10% in the second half of the session.
- BTC/USD is moving within a narrowing range as the price presently consolidates.
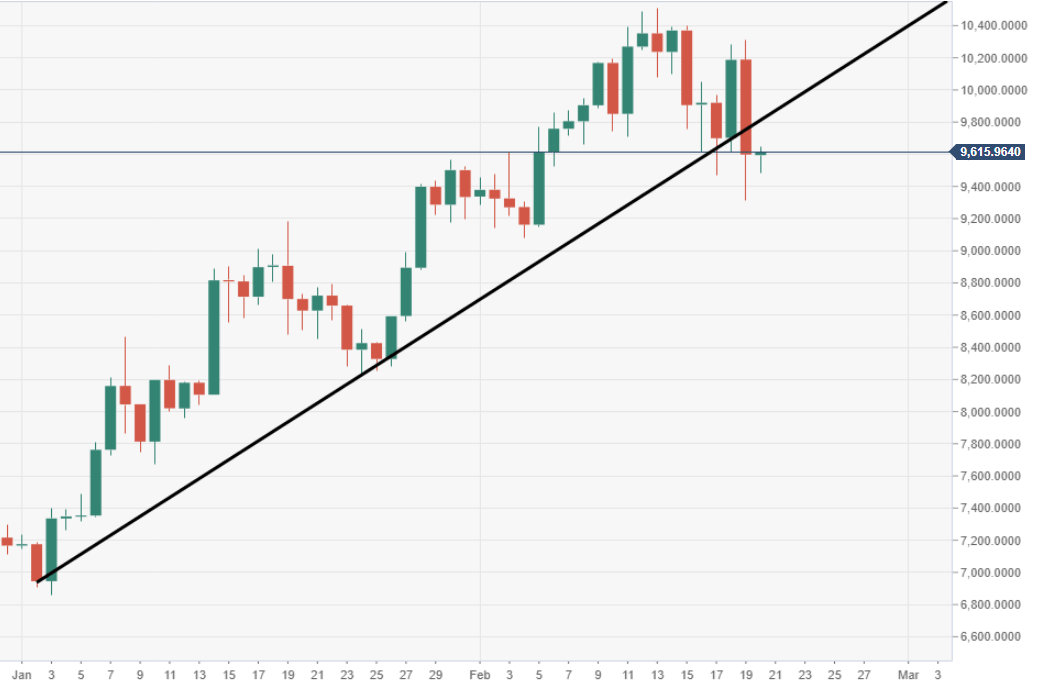
- Price action broke and closed below a critical supporting ascending trend line.
BTC/USD daily chart
A critical daily zone of support should be noted at the range of $9600-9400.
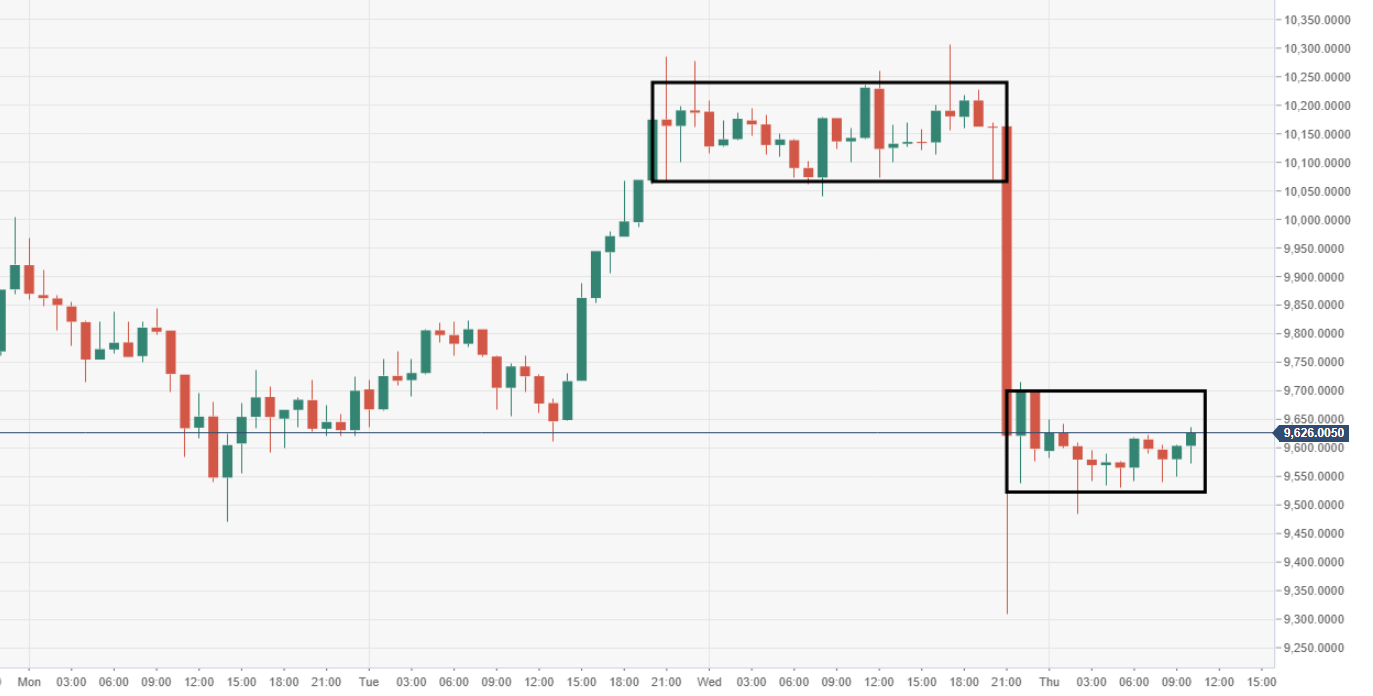
BTC/USD 60-minute chart
Price action smashed out to the downside from a narrowing range-block formation, another can be observed currently via the 60-minute chart view.
Spot rate: 9,606.40
Relative change: -0.10%
High: 9,636.70
Low: 9,483.82
