- Bitcoin price is nursing minor losses through the mid-point of Thursday, down just some 0.15%.
- The 60-minute chart view can see a bullish flag pattern formation for BTC/USD.
The Bitcoin price is seen trading marginally in negative territory, down just some 0.15%, through the mid-point of Thursday’s session. BTC/USD looking to further pullback after the price pressures at the start of the week.
In terms of news flow, the Bitmax CEO, anticipates the cryptocurrency bear market to last 18 months more. Arthur Hayes was quoted saying, “My view is the volatility environment that exists right now could persist for another 12 to 18 months, the flatness. “I’m just basing it off my previous experience. I started in bitcoin in 2013 when the price went from $250 to $1,300 and then 2014 to 2015 was sort of the nuclear bear market. Price crashed, volume crashed “” very, very difficult to make money.” He was speaking with Yahoo. Bitmax is a cryptocurrency exchange and derivative trading platform.
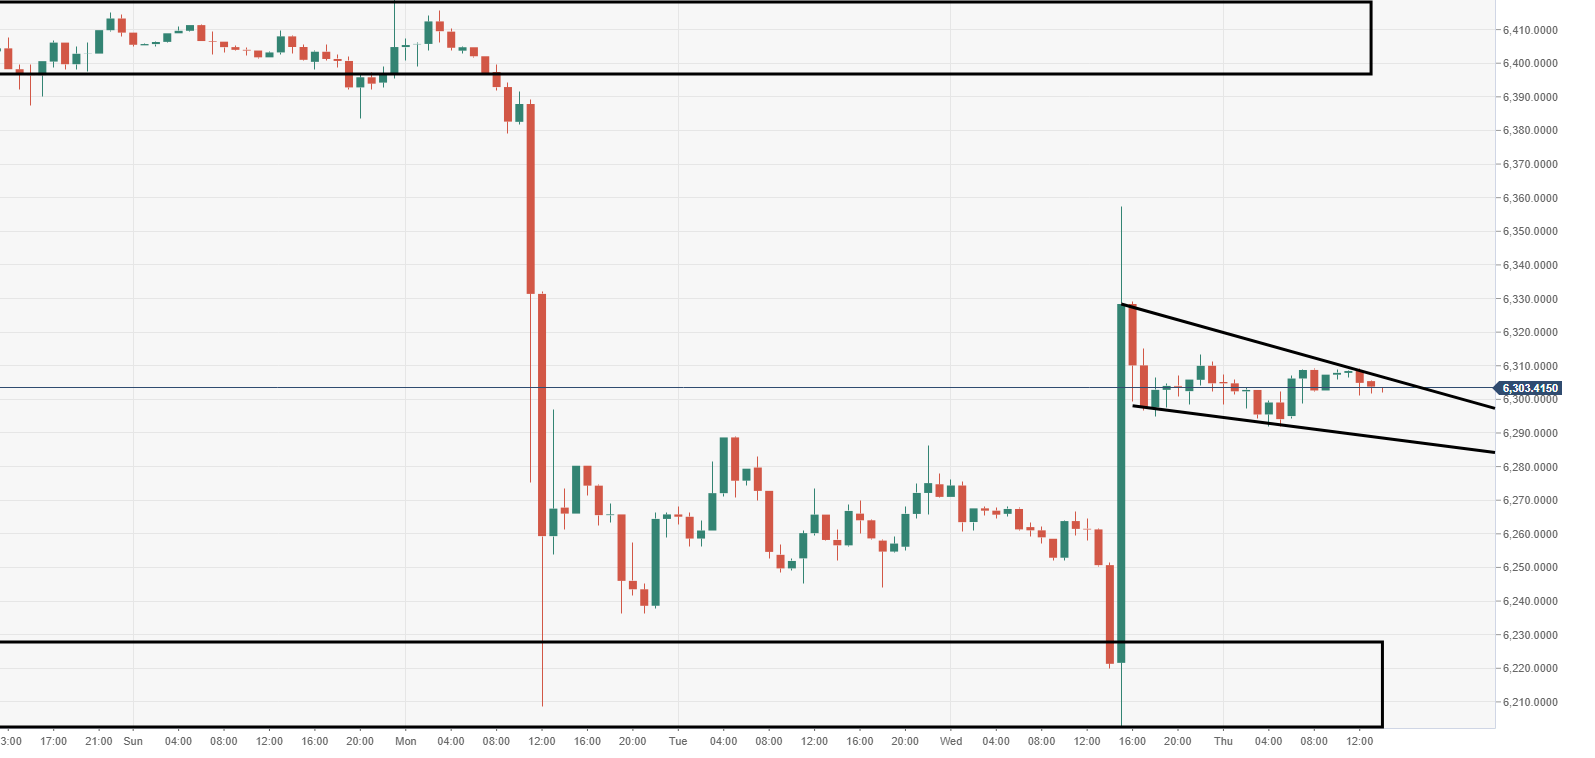
BTC/USD price action has formed a bullish flag pattern, as seen on the 60-minute chart view. Near-term resistance is eyed at $6306, which is the upper trend line of the flag. A breach could open the door to a run up to $6400 territory, where a supply zone is seen tracking. Near-term support can be observed at $6285, the lower part of the flag. Should this fail to hold, eyes will be on the below demand area, $6200.
BTC/USD 60-minute chart