- BTC/USD has made another attempt to move above $8,000.
- Strong resistance is created on approach to $8,100.
On intraday timeframes, BTC/USD has been moving in a tight range with mildly bullish bias with the recent recovery attempts limited by $8,100 handle. This resistance area, strengthened by the upper line of 4-hour Bollinger Band, needs to be taken out before we can claim that the breakthrough is confirmed.
Once this happens, the upside may gain traction with the next focus on $8,200. This resistance area is created by the middle line of 1-day Bollinger Band, which is followed by SMA100 (Simple Moving Average) 4-hour (currently at $8,235). A sustainable move above this area will open up the way towards the next bullish aim of $8,500.
While the Relative Strength Index (RSI) on the intraday timeframes points upwards, the further upside is not yet guaranteed. If the price fails to settle above $8,000, the bearish sentiments will sweep through the market once again. In this case, the sell-off may take BTC towards the first support area created by a confluence of SMA50 and the middle line of 4-hour Bollinger Band. Once it is cleared, the downside momentum is likely to gain traction with the next focus on $7,640 (the lower edge of 4-hour Bollinger Band), and psychological $7,500.
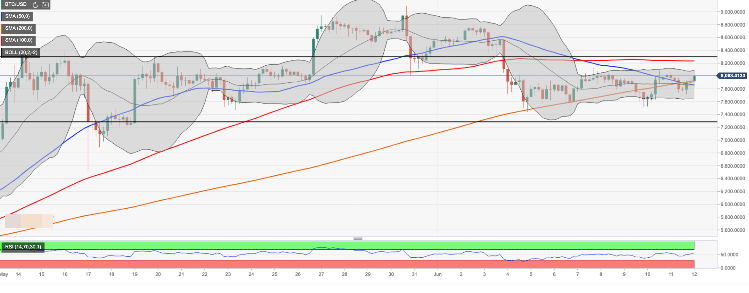
At the time of writing, BTC/USD is changing hands at $8,018, marginally higher both on a day-on-day basis and since the beginning of Wednesday.
BTC/USD, 4-hour chart