- Bitcoin price is trading above the pivotal $6,700, but its trend is strongly bullish.
- A break above the intraday cap at $6,750 is to pave the way towards the critical $6,800.
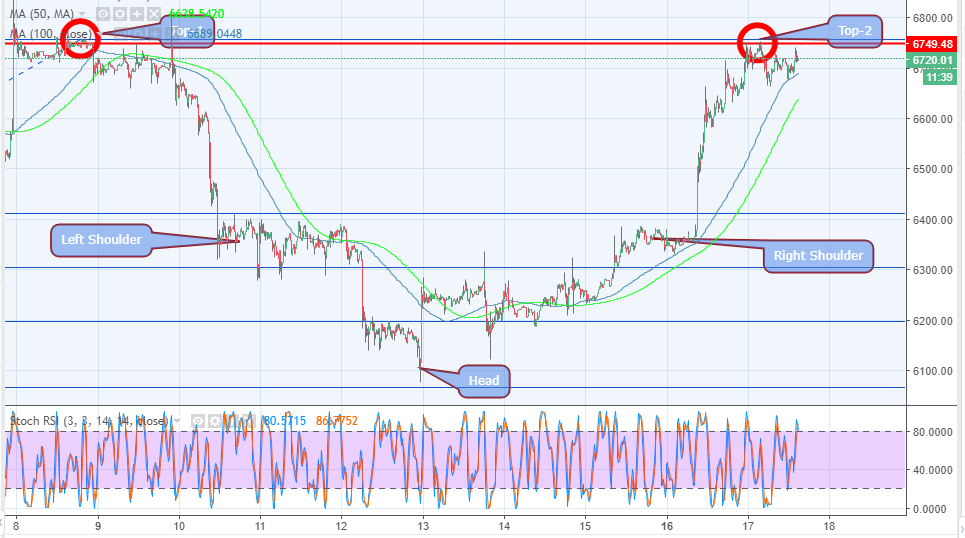
There are a couple of patterns that can be observed on the Bitcoin chart. The first one is the double top pattern which was explored in an earlier price analysis, while the second and most important is the inverse head-and-shoulders pattern. Spotting these patterns can help make better trading decisions.
Trading a double top pattern signals a bearish movement after a continuous uptrend. While Bitcoin price has formed a double top pattern, it is clear that its effect has been minimized by the inverse head-and-shoulders pattern, which sends signals of an upcoming following a downtrend. Bitcoin price jumped over 5% yesterday, supported by the support at $6,400 (former resistance). The recoil pushed above $6,600 and changed hands above $6,700 but the momentum failed to break past $6,750.
The price has been pivotal around $6,700 while the intraday cap is stubbornly sitting at $6,750. The trend is still bullish and a break above this level means that $6,800 is in sight and well within reach in the short-term. If the momentum stalls short of the intraday cap, a consolidation above $6,700 will allow the investors to regain strength to retest the area at $6,800 and eventually revisit $7,000.
BTC/USD 15-minutes chart