- Bitcoin has continued to be under pressure, seen down around 1% on Friday, after a week of selling.
- BTC/USD on the daily time frame has seen a hammer candlestick, which could be the indication of a reversal to come.
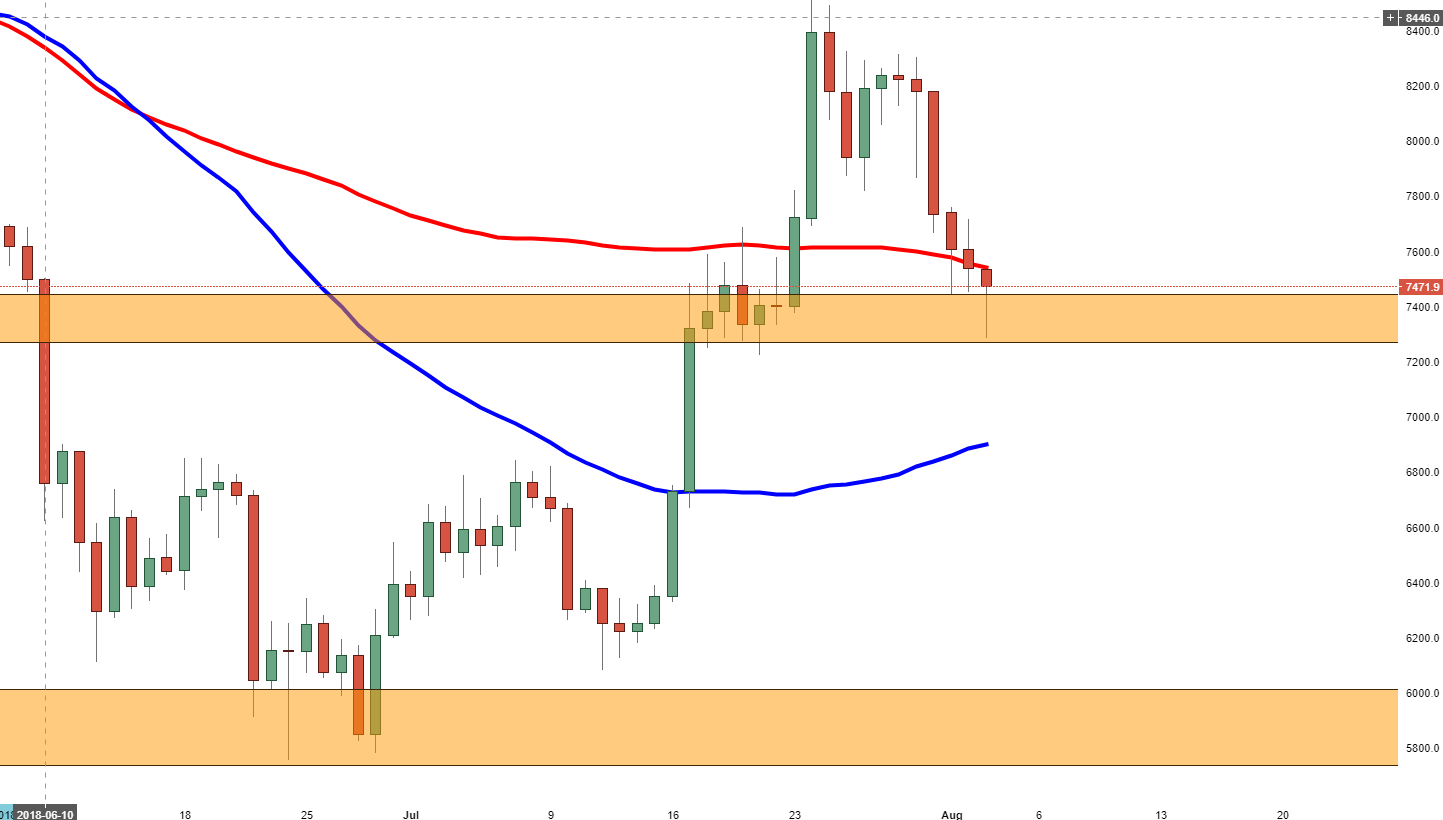
Bitcoin was down again on Friday, dealing with losses of around 1%, after a consistent bought of selling seen for the crypto market across the board. BTC/USD has traded down for six consecutive sessions now.
BTC/USD via the daily time frame is seeing a hammer candlestick take form, which if played by the textbook could start to see a reversal. This will Bitcoin has lost some 12% in value, dropping from around $8300 down to $7200.
Technically, given the hammer candlestick seen on the daily time frame, allied with BTC/USD trading within a touted demand zone, some decent bullish upside may be imminent. The supporting area tracks from $7450 down to $7281.
BTC/USD daily chart