- The study took data from major currencies including Bitcoin, Ethereum, Ripple, and Litecoin.
- BTC/USD is trading slightly below $6,500, but the immediate support at $6,480 is still holding ground.
The cryptocurrency market is not just bleeding on Friday morning (GMT), it is sinking in the sea of red rough waters. Bitcoin price particularly has declined more than 3% on the day. The rest of the digital assets are also making considerable falls. Bitcoin is trading a double bottom pattern, but we will come to that in a bit.
In the meantime, the American Institute For Economic Research (AIER) is said to have released a report that indicates that Bitcoin, the king of the cryptos has not been as volatile in comparison to other virtual currencies. The institute is independent of all third parties or special interest groups. The volatility data has been taken since the year 2013 and speaks of the maturity of Bitcoin. The study took data from other major currencies like Ethereum, Ripple, and Litecoin. The researchers at AIER explained how they reached to their conclusion saying:
“Economists and statisticians measure a variable’s volatility in many ways. We choose a relatively simple metric: the average daily percentage change in price. We average the absolute value of daily percentage returns for each cryptocurrency and year.” The researchers added, “By our measure, in every year, Bitcoin is the least volatile of the five cryptocurrencies we study (we also looked at coefficients of variation, a more technical measure, which yielded similar results). Bitcoin reached its lowest average daily price movement, less than 2 percent, in 2016, before rising again to levels not seen since 2013,”
Bitcoin price analysis
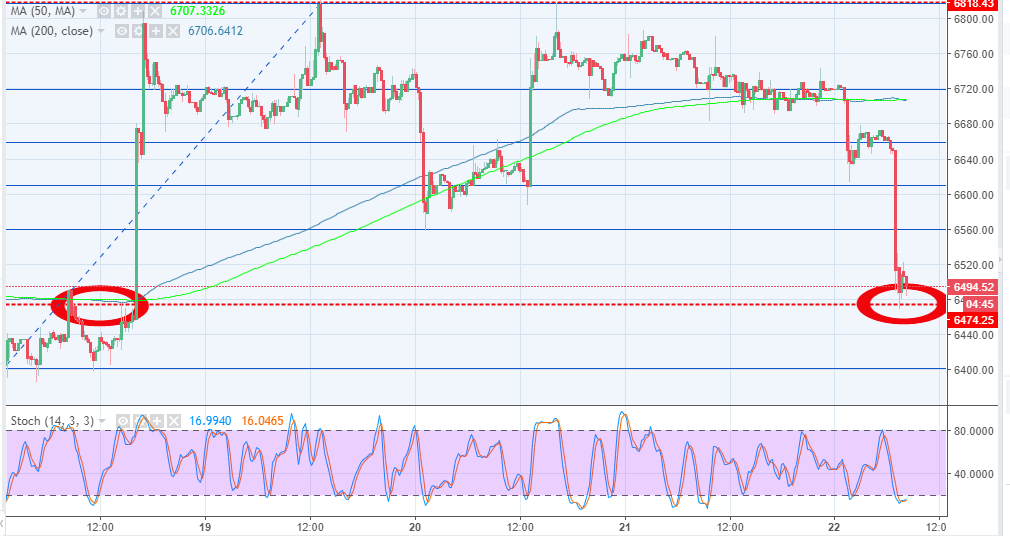
As mentioned earlier, Bitcoin price is approaching a double-bottom pattern which also could mean that a reversal is underway in the near-term. The support levels at $6,640 and $6,600 we explored during the analysis on Thursday 21 failed to hold price. Moreover, several Fib retracement levels also gave in to selling pressure. BTC/USD is trading slightly below $6,500, but the immediate support at $6,480 is still holding ground. There are a couple of more significant support zones at $6,440 and $6,400. The price is likely to form a bearish flag pattern pending an upside breakout.
BTC/USD 15′ chart