- BTC/USD picks up bid inside a short-term symmetrical triangle.
- Sustained trading beyond key SMA, upbeat oscillators favor bulls.
BTC/USD rises to $36,158, up 0.55% intraday, during early Wednesday’s trading. The famous cryptocurrency pair recently reversed from $35,654 while staying inside a symmetrical triangle established since January 04.
Not only the recent recovery moves but the quote’s successful trading above 200-bar SMA amid upbeat RSI and MACD also suggest the quote’s further upside.
As a result, BTC/USD buyers should keep their eyes on the triangle resistance, at $38,325 now, for fresh entry while targeting the latest record top near $42,000.
It should, however, be noted that the $50,000 round-figure will lure the bulls past-$42,000.
Meanwhile, a downside break of the stated triangle’s support, currently around $35,200, will trigger fresh declines to a 200-bar SMA level of $31,100.
Though, any further weakness past-$31,100 may not hesitate to challenge the $30,000 threshold and monthly low near $27,780.
BTC/USD four-hour chart
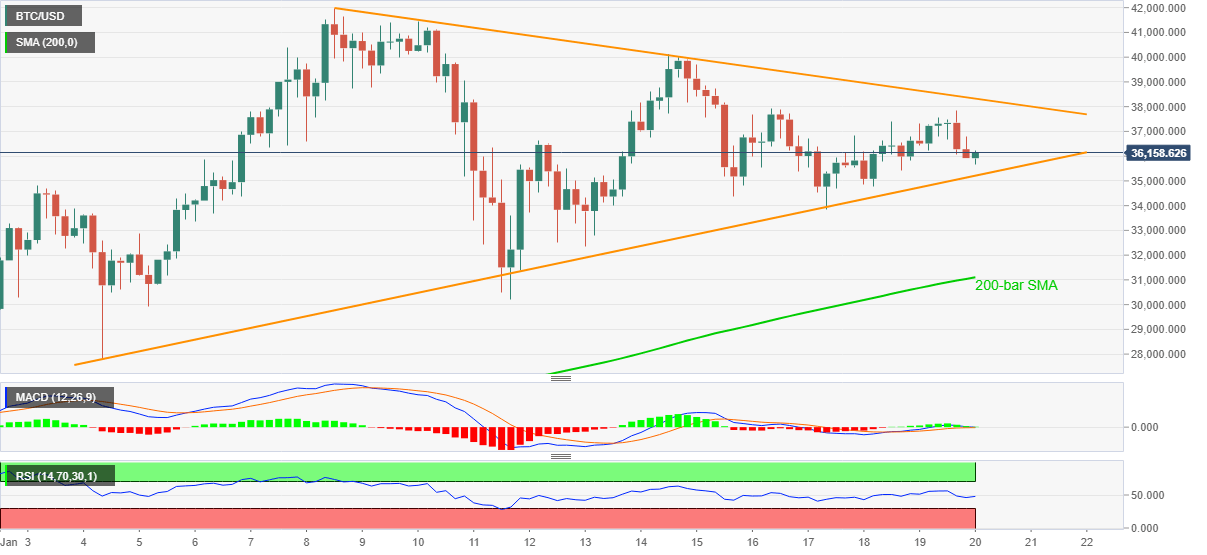
Trend: Bullish
