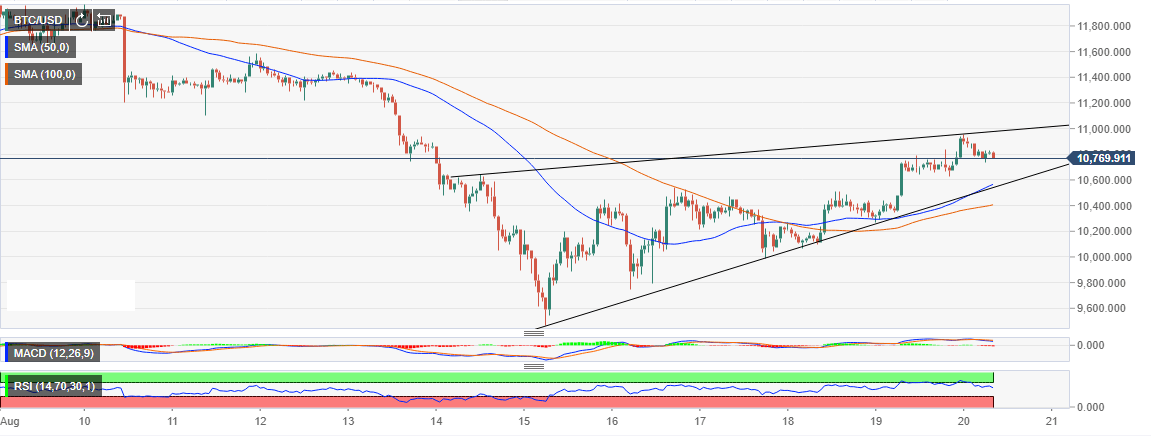
- Bitcoin hits the pause button within a whisker of $11,000 as declines set in.
- Bitcoin is trading at $10,772 amidst a building bearish momentum.
- BTC/USD is likely to plunge under $10,000 and even explore last week’s lows $9,469.
Bitcoin’s spectacular movement to levels slightly below $11,000 has astonishingly hit the pause button. As discussed yesterday, the weekend session was enviable with Bitcoin breaking above the 50 Simple Moving Average (SMA) and the 100 SMA one-hour. Consequently, the break above $10,400 hurdle opened the door for gains above $10,700. This completed the leg from the former resistance at $10,200.
The high formed at $10,958 gave the bears a gap which they are currently exploring. At press time, Bitcoin is trading at $10,772 amidst a building bearish momentum. If the rising wedge pattern support is broken, BTC/USD is likely to plunge under $10,000 and even explore last week’s lows $9,469.
The prevailing trend, however, is more or less sideways with a bottom inclination. The Moving Average Convergence Divergence (MACD) is still within the positive region. The slightly bearish divergence means that the bears have an upper hand. Besides, the Relative Strength Index (RSI) is slowly retreating from the overbought. The RSI’s movement towards the average could encourage the sellers to increase their positions further pushing the price lower.
BTC/USD 1-hour chart