- Bitcoin price nurtures stability above $5,000 while the upside is capped under $5,500.
- Bitcoin miner capitulation sparks mixed reactions with some analysts choosing to remain bulling and long BTC.
Bitcoin price show stability in the last 24 hours sees analysts predict a bottom is nigh and that means a rally is brewing not too far downstream. A minor dip under $5,000 on Monday painfully reminded the investors of last week’s gruesome rollercoaster dive to levels under $4,000. A recovery, however, ensued pulling BTC/USD upwards. Seller congestion at $5,500 made sure that the critical level at $6,000 is not tested. Bitcoin has been swinging between $5,000 and $5,500 in the last 24 hours.
At the time of writing, BTC/USD is teetering at $5,145. The market value follows a 3.50% loss on the day. A bearish trend coupled with high volatility risks ousting the stability enjoyed and paving the way for exploration activities under $5,000.
Bitcoin miner capitulation
Talks and discussions around “Bitcoin miner capitulation” have been surging on Twitter after Bitcoin lost more than 40% of its value in just a few days. Before the market crash, the cost of mining averaged at $8,000. However, a chart shared by Byzantine General, shows this cost has adjusted lower to $7,700.
Both the $BTC production cost and average miner cash flow arrive at the 7700 level.
This definitely isn’t an important level or anything pic.twitter.com/5SF0V0LczA
— Byzantine General (@ByzGeneral) March 8, 2020
Following the crash last week, Bitcoin is trading significantly under the above mining cost, which means if the price fails to reverse, most miners could close up shop, potentially paralyzing the BTC network. Although most people are still bearish some like ‘light’ and ‘DonAlt’ on Twitter are choosing to be bullish and long Bitcoin.
If I had to choose just one lesson to keep after years of trading crypto, it would be this:
When people start trotting out the miner capitulation narratives, make sure you’re long BTC.
— light (@LightCrypto) March 17, 2020
This narrative play is still active.
It made me take advantage of the FOMO rally and prepared me for the crash into the event.Now that the narrative has switched from “halving is going to be bullish” to “miner capitulation” it’s time to look for longs again.
Give it some time.
— DonAlt (@CryptoDonAlt) March 17, 2020
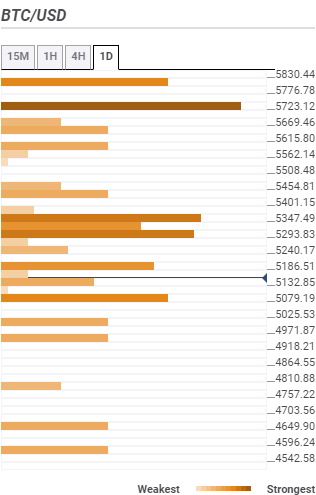
Bitcoin price confluence detector resistance and support areas
Resistance one: $5,186 – SMA 200 15-minutes, the previous high 15-mins and Fibo 61.8% one-day.
Resistance two: $5,347 – SMA 100 15-mins and Bollinger Band one-hour middle.
Resistance three: $5,723 – Highlighted by the pivot point one-month support three.
Support one: $5,079 – Fibonacci 23.6% one-week.
Support two: $4,971 – Previous low one-day.
Support three: $4,810 – Bollinger Band 4-hour lower curve.