- Bitcoin has explored higher levels forming a higher low and a higher high pattern.
- A correction above the 21EMA is likely to launch Bitcoin in an upward trajectory.
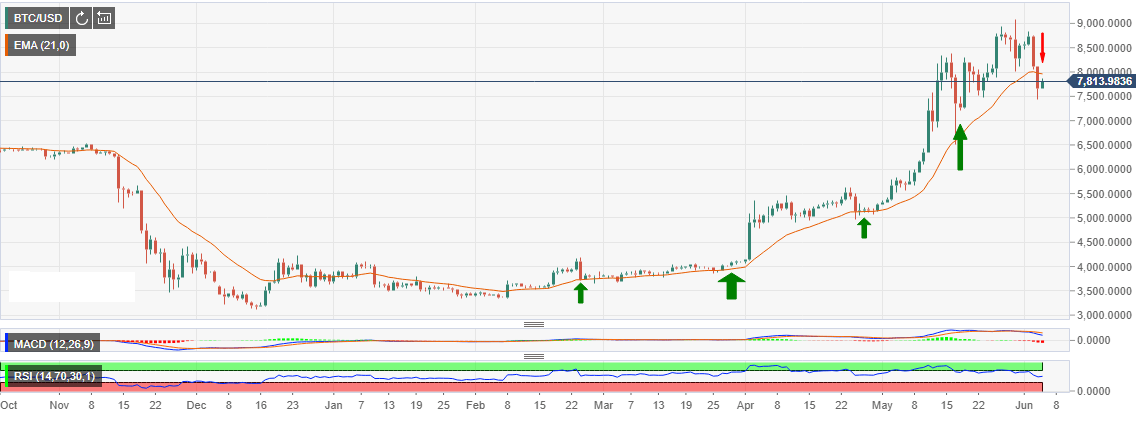
A look at the daily chart, we see a significant retracement from the recent highs from above $9,000. The correction broke below key support that has functioned as Bitcoin’s bouncing wall for at least four months. Over the last two months, Bitcoin has explored higher levels forming a higher low and a higher high pattern. The surge in May confirmed to many investors that Bitcoin and the cryptocurrency market had finally entered a bullish phase and for BTC/USD correction above $10,000 is an impending possibility.
However, Bitcoin’s drop on Tuesday continues to dwarf the hopes of seeing it above $10,000 in the short-term. The losses extended below the historical 21-day exponential moving average (EMA). The declines were unstoppable at $7,800, fortunately, the dying bear momentum allowed the bulls to put a stop at $7,500.
Bitcoin has since recovered to reclaim the support at $7,800 and is trading at $7,811. A correction above the 21EMA is likely to launch Bitcoin in an upward trajectory above $8,000. However, traders should not expect any significant movement above $8,000 in the coming sessions. Support above $8,000 will, however, allow the bulls to gather strength to attack higher levels towards the coveted $10,000 level.
BTC/USD daily chart