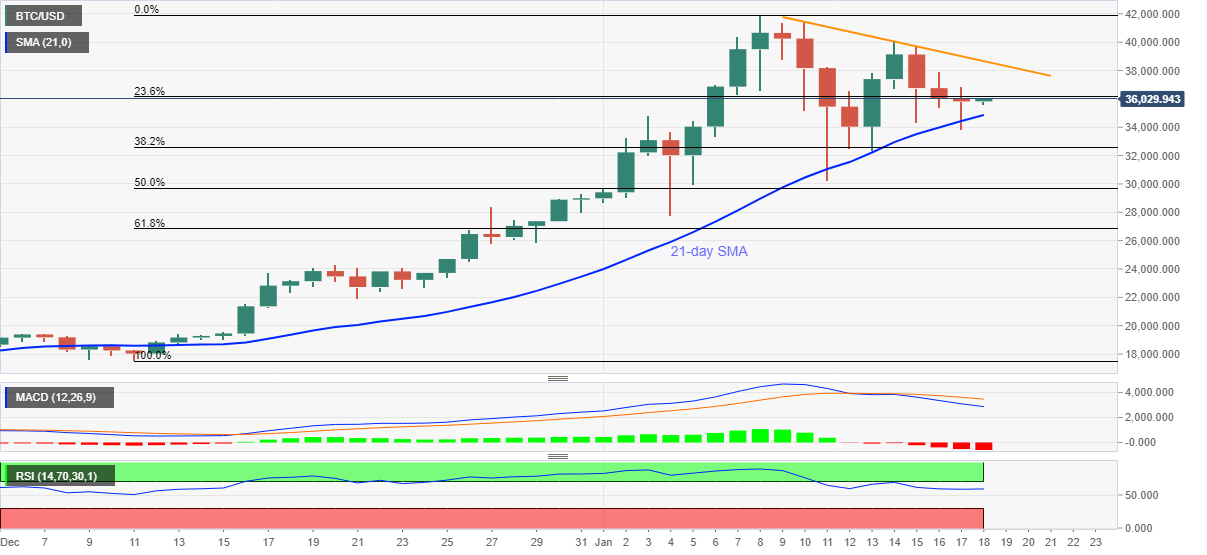
- BTC/USD picks up bids from $35,576, manages to stay above 21-day SMA.
- Bearish MACD, one-week-old faling trend line challenge buyers.
- Monthly low, key Fibonacci retracement levels add to downside filters.
BTC/USD bounces off intraday low of $35,576 to tease the $36,000 threshold, currently around $35,860, during early Monday. The crypto major dropped to the lowest since January 13 the previous day but failed to provide a daily closing below 21-day SMA.
As a result, the following corrective pullback probes BTC/USD sellers for the first time in four days even as bearish MACD and short-term resistance line test the quote’s upside momentum.
That said, $37,980 and the $38,000 round-figure can offer immediate resistance to BTC/USD ahead of highlighting a downward sloping trend line from January 10, 2021, at $38,665 now.
In a case where the BTC/USD bulls manage to cross the $38,665 level, the $40,000 psychological magnet and the recently marked record top near $42,000 should return to the charts.
Meanwhile, a downside break of 21-day SMA, currently around $34,590, can direct short-term sellers toward the monthly low of $30,209 and then to the $30,000 threshold.
However, any further downside below $30,000 will make BTC/USD vulnerable enough to revisit the 50% and 61.8% Fibonacci retracement level of December-January upside, respectively around $29,700 and $26.830.
BTC/USD daily chart
Trend: Pullback expected
