- Bitcoin trades near key Fibonacci retracement level on Saturday.
- 20-day moving average acts as a dynamic resistance.
- Daily RSI continues to move sideways near 50.
Bitcoin (BTC/USD) failed to hold above $10,000 earlier in the week and dropped to $9,280 on Wednesday. Although the pair was able to post small recovery gains on Thursday and Friday, it struggled to gather momentum and has gone into a consolidation phase on Saturday. As of writing, the pair was down 0.55% on the day at $9,645.
Technical outlook
The daily Relative Strength Index (RSI) for Bitcoin is moving sideways near the 50 mark to reflect its indecisiveness in the near term. However, the pair is currently trading near a critical level and a weekly close either below or above that level could provide a directional clue.
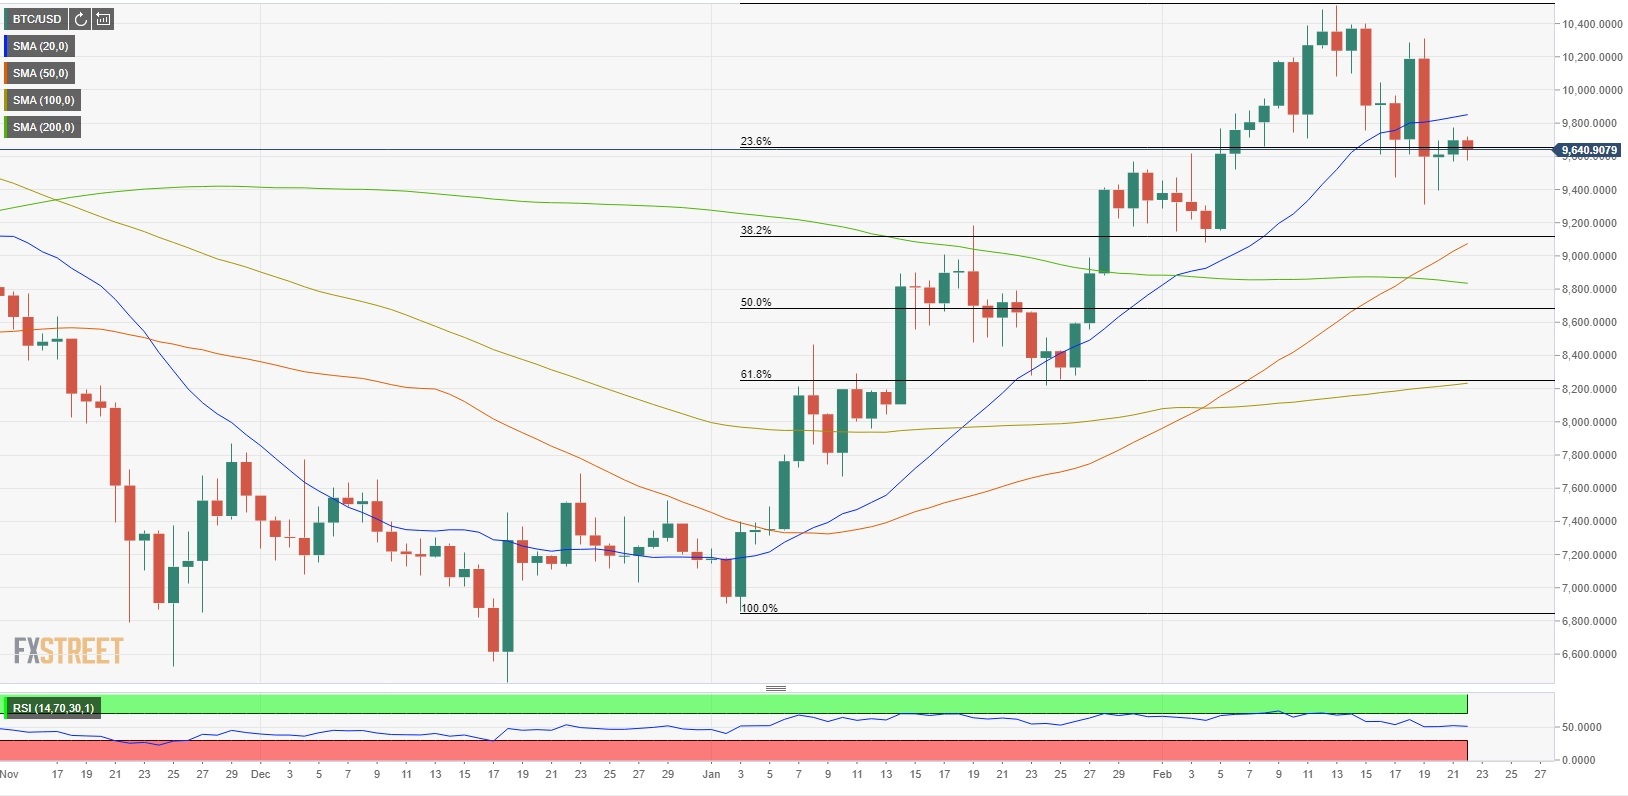
The Fibonacci %23.6 retracement of the rally that started in early January and ended in mid-February is located near $9,600. Above that level, the 20-day SMA at $9,850 could act as an interim resistance ahead of $10,000 (psychological level).
On the downside, $9,300 (February 19 low) aligns as the initial support ahead of $9,100 (Fibonacci 38.2% retracement of the same rally/50- day SMA) and $8,800 (200-day SMA).
BTC/USD daily chart