- Bitcoin celebrates gains two days in a row despite stopping short of $11,000.
- Short-term technicals are relatively bearish but support is expected at $10,500 and $10,250.
Bitcoin bulls have had a field day for two days in a row. After breaking past $10,000 and $10,400 in the rearview, Bitcoin bulls continued throwing jabs towards $11,000. A remarkable move on Tuesday completed the leg above $10,700. However, a correction occurred on hitting a snag at $10,795.
In spite of the drop, the downside has been extensively protected around $10,500. Also, the price has sustained the ground above the moving averages. Bitcoin has a market value of $10,601 at the time of press. The cryptocurrency live rates table displays a negative trend for Bitcoin in the short-term citing a relative change of -34.
Read also: Bitcoin ‘two steps’ to $20,000: Predicts BitMEX CEO Arthur Hayes
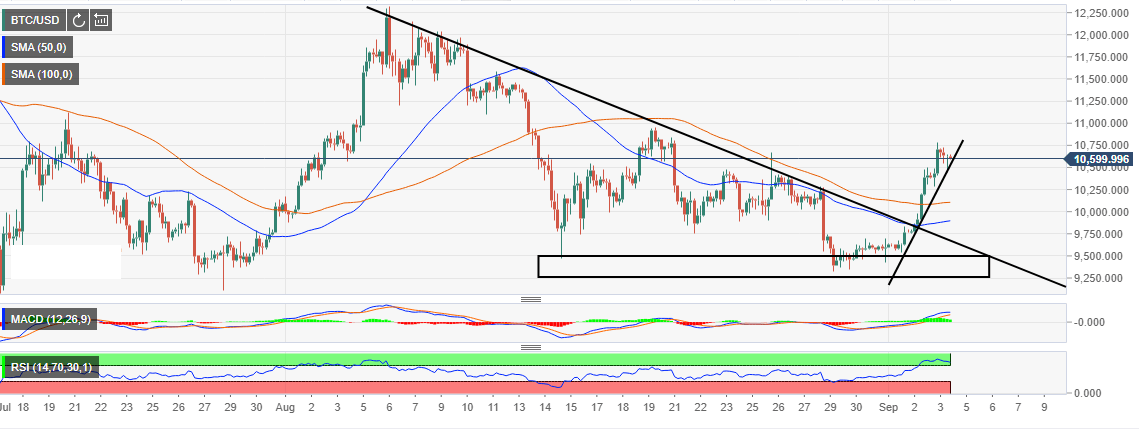
On the other hand, the 4-hour chart illustrates a sustained technical picture. Applied technical indicators like the Relative Strength Index (RSI) and the Moving Average Convergence Divergence (MACD) suggest that BTC’s upward momentum still has strength. The RSI is holding ground at 80 while the MACD at +278. A positive divergence in the MACD hints of the higher presence of buyers and increasing buying entries.
In the event $10,500 support gives in to selling pressure, $10,250 is in line to offer support. The 100 Simple Moving Average and the 50 SMA will also come in handy in case of extended declines. The major support lies between $9,500 and $9,250.
BTC/USD 4-hour chart