- Bitcoin’s bullish trend is gaining traction.
- BTC dominance is growing amid flight to safety.
BTC/USD hit $6,316 during early Asian hours before retracing to $6,247 by the time of writing. The world’s most popular digital asset broke above psychological $6,300 for the first time since mid-November 2018. It is on track to have four days of strong growth in succession and finish the week with gains.
It is also work noting that Bitcoin market dominance catapulted to the highest levels since September 2017 as altcoins are in red. Apparently, cryptocurrency traders bet on Bitcoin amid growing anti-risk sentiments on the global financial markets. BTC/USD has gained nearly 3% in recent 24 hours and 1.5% since the beginning of the day.
Bitcoin’s technical picture
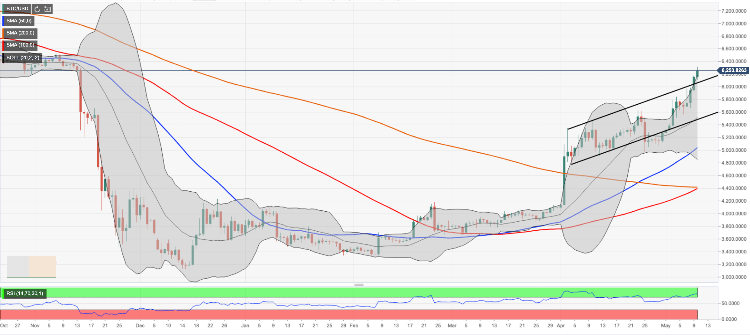
BTC/USD broke above the upside channel and managed to keep ground above $6,200, which is considered a positive signal in the long run. Moreover, the price came close to SMA100 weekly at $6,335. Once this barrier is out of the way, the next target $6,500 will come into view.
On the downside, the initial support is now created by $6,200 with the upper boundary of 1-day Bollinger Band located right below the handle. Once below, the sell-off may be extended towards the above-said broken channel resistance and to $6,000, where a new buying interest is likely to appear.
BTC/USD 1-day chart