- Bitcoin price breakout towards $9,400 hits a wall at $9,382.
- A pre-halving rally seems possible especially with bullish interest growing in the market.
Bitcoin price has extended the action above $9,200 to an extent of touching $9,382 (intraday high). Following the brief surge on Thursday, BTC/USD is dancing at $9,276 from the opening value of $9,158 and representing a 1.27% growth in value.
The rest of the cryptocurrency market is in the green according to the cryptocurrencies live rates table. For instance, Ethereum is up 2.64% to trade at $204, Ripple price up 1.38% and exchanging hands at $0.2148 and Bitcoin Cash has accrued 1.1% in gains to trade at $244. Other key intraday winners are IOTA (2.27%), EOS (1.65%) and Ethereum Classic (1.81%).
Looking at the daily chart, Bitcoin price is poised for more upward action. The RSI has made a comeback into the overbought region. A continued upward motion could spur more growth towards $9,500 resistance. Consequently, the 50 SMA is narrowing the gap between 200 SMA as a show of strength from the bulls. As long as Bitcoin stays above $9,200 before halving, the potential for gains above $10,000 will remain massive.
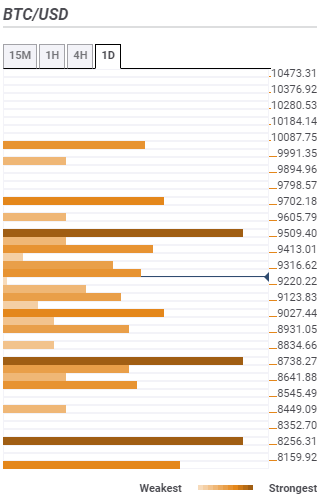
Bitcoin confluence resistance and support levels
Resistance one: $9,316 – Highlighted by the SMA ten 1-hour, the previous high 15-minutes, and the Fibonacci 23.6% one-day among others.
Resistance two: $9,702 – As shown by the pivot point one-day resistance two and the pivot point one-week resistance one.
Resistance three: $10,087.75 – Highlighted by the pivot point one-month resistance one.
Support one: $9,123 – Is the region where the SMA 200 15-mins, the Fibo 61.8% one-day and the Bollinger Band 1-hour lower curve.
Support two: $8,738 – This zone is home to the 23.6% Fibo one-month and the Fibo 38.2% one-week.
Support three: $8,256 – As highlighted by the Fibo 38.2% one-month and Fibo 61.8% one-week.