- Bitcoin loses momentum after rising for two days.
- 20 and 50-day SMAs form a short-term resistance area.
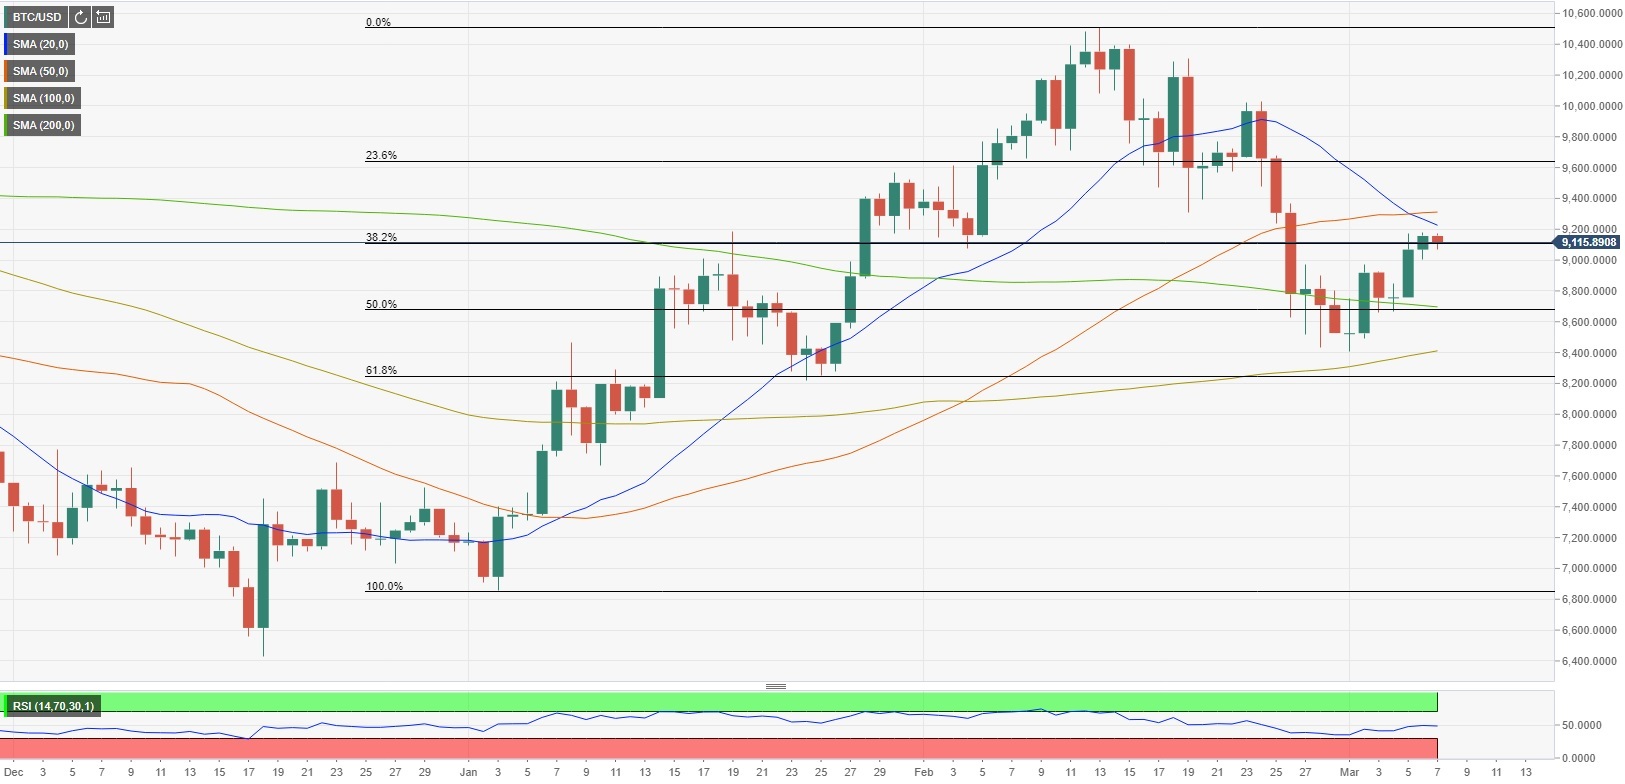
- RSI on the daily chart continues to move sideways near 50.
Bitcoin touched its highest level in ten days at $9,180 on Friday but struggled to push higher amid a lack of volume. As of writing, the pair was trading in a relatively tight range near $9,100, posting small daily losses.
Technical outlook
Looking at the daily chart, a bearish cross between the 20-day SMA and the 50-day SMA, which are both floating a little above the price, seems to have occurred, suggesting that the bullish momentum is struggling to buildup. In the meantime, the RSI indicator on the same chart continues to move sideways to show the pair’s indecisiveness in the near-term.
At the moment, the pair is trading at $9,100, where the Fibonacci %38.2 retracement of the rally that started in early January and ended in mid-February is located. With a weekly close above that level, the pair could target the Fibonacci 23.6% retracement of the same rally at $9,600. However, $9,300-$9,400 (area (20-day SMA-50-day SMA) could act as interim resistance.
On the other hand, $9,000 (psychological level/Friday low) could be seen as the initial support ahead of critical the $8,700 (200-day SMA/Fibonacci 50% retracement) level.