- “Price-wise, we’ll continue to see Bitcoin move higher. I’ve revised my estimate up to $250,000 four years out”¦,” said Tom Draper.
- The 50 SMA is below the 100 SMA to show that the past of least resistance is to the downside.
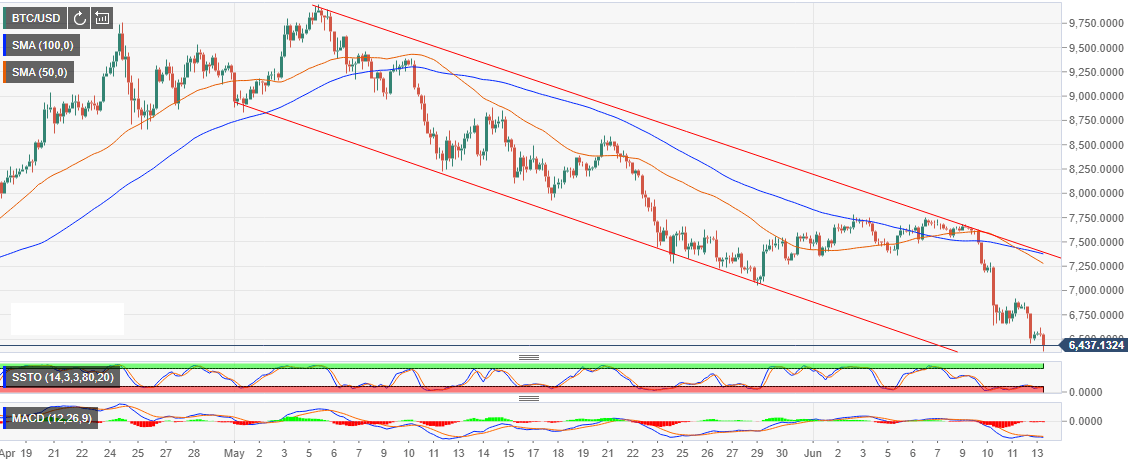
Bitcoin price free fall seems to have engaged a stronger gear. The king of the digital assets is now trading marginally above $6,430, but there is a dominant selling pressure in the market. A close look at the 4-hour timeframe chart, we can see that Bitcoin price after trading above $9,500 at the beginning of May, has not been able to break out of the descending channel. Several support areas are highlighted along the way, but all have given in to the long-term bear pressure.
On the contrary, it is not all gloomy in the market, as an interview conducted by The Street with the Bitcoin Bull and Billionaire Tim Draper revealed the thoughts of the mogul about the future of Bitcoin along with other virtual currencies. He began by shedding light on the status of regulations in the space saying that currently states governments are in competition to draw the attention of companies concentrating on blockchain infrastructure. He said that to do so they must come up with “very clear and light-touch regulations for crypto.” Draper said that Bitcoin is, in fact, is the most secure crypto and made his predictions on the price:
“Price-wise, we’ll continue to see Bitcoin move higher. I’ve revised my estimate up to $250,000 four years out, so we’ll see Bitcoin trade around the $250,000 mark in 2022.” He added, “I have no interest in selling my Bitcoin. What would I sell it into anyway? Moving from crypto to fiat is like trading shells for gold. It is reverting to the past. I’m thinking long term I’ll use it, spend it, invest it, or just keep it.”
Technically, Bitcoin price is down 1.62% on the day while the trend is highly bearish. The indicators on the chart show continued selling pressure in the near-term. For instance, the 50 SMA is below the 100 SMA to show that the past of least resistance is to the downside. The Stochastic on the 4-hour chart is in the oversold levels while the MACD is at -234 mark. BTC/USD is supported weakly at $6,430, but $6,400 is well within reach. The gains have been limited below $6,500 on the day while the key resistance zone is at $6,750.
BTC/USD4-hour chart

