- Bitcoin has established a support at $6,380 while defending the short-term support at $6,400.
- The crypto market is in the green following an extended period of stability especially for Bitcoin and Ethereum.
The market is green on Tuesday following the consolidation that occurred on Monday after the spike on Sunday. Bitcoin (BTC) as discussed earlier recovered from range taking back the support at $6,400. The buyers increased their grip on the price on Sunday, the price touched $6,440 on the upside before correcting lower. Bitcoin has established a support at $6,380, which has opened the road a retracement above $6,400.
Besides, the largest crypto is in the market has formed a bullish flag pattern. A break above this pattern has tested the resistance at $6,440. BTC/USD is trading at $6,401 amid an ongoing bearish trend. The RSI has changed direction downwards to show that the bears are increasing their presence in the market while the MACD is ranging faintly above the mean level to show that the buyers have the momentum to defend the support ($6,400).
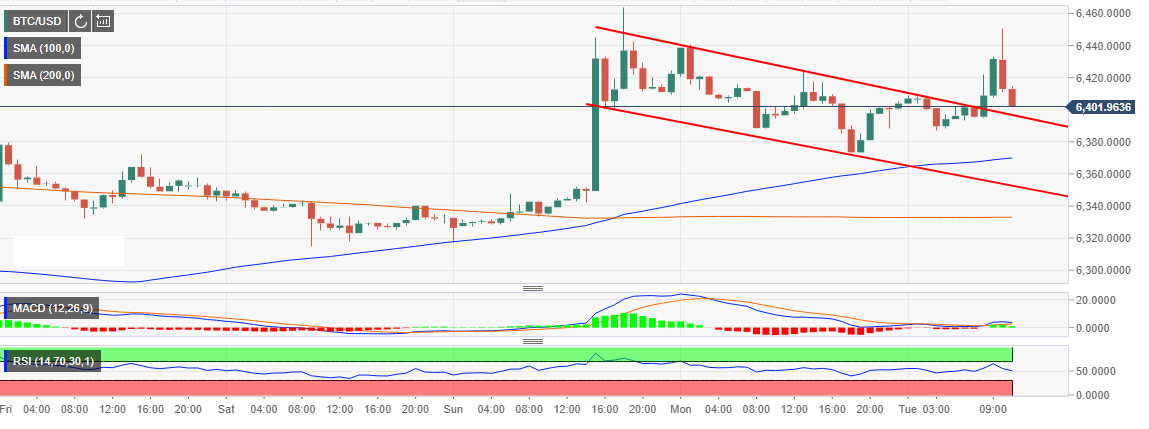
A look at the chart shows that Bitcoin will test the support at $6,380 especially if the support mentioned before is broken. The 50 SMA will provide anchorage as seen on the hourly chart at $6,370 while the 100 SMA at $6,332.50. the biggest task for the bulls is to defend the support at $6,400 and fight to take the back above $6,420 for a retracement past $6,440 in the medium-term.
BTC/USD 1-hour chart