- BTC/USD is moving within a bullish trend.
- $4,200 is the key resistance to be taken out.
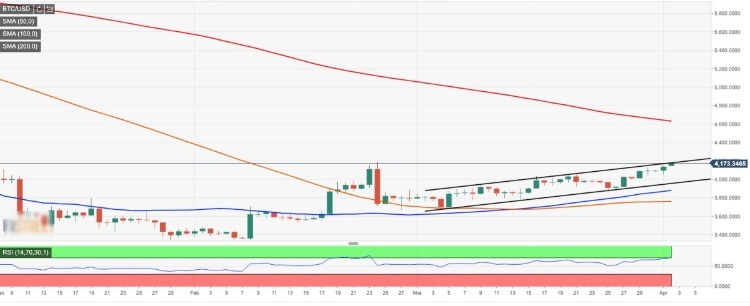
Bitcoin finished the first quarter of 2019 in a green zone; however, it is still below critical $4,200 handle. At the time of writing the first digital coin is changing hands at $4,170, gaining 1.5% in recent 24 hours.
From the long-term point of view, we will need to see a sustainable move above $4,200-$4,230 area to set the stage for an extended recovery towards $5,000.
A bullish candle after a period of indecision represented by two Doji candles on a daily chart highlights the continuation of the upside trend. The daily RSI also confirms the bullish stance.
Meanwhile, on the downside, the local support is created by $4,000. This area served as a strong resistance, now it has turned into a strong support. Once it is cleared, the sell-off may be extended towards $3,950 (the lower boundary of the short-term upside channel) and $3,900 supported by DMA50.
BTC/USD, 1D chart