Bitcoin price fell below the $30,000 psychological level for the second time since reaching the April 14 all-time high around $64,800. BTC has been largely bullish as it failed to break above the $36,000 zone throughout July.
The flagship cryptocurrency started the week around $31,400 after spending the weekend in a tight range between $31,100 and $32,500 , before tanking below $30,000 on Tuesday morning.
Strong Dollar Keeps Bitcoin Price Lower
A strong dollar has been credited for the collapse of the crypto market seen on Tuesday morning. The greenback was strong across most platforms as it rose to a new high in over 3 months. The dollar remained strong against major currencies as the Delta variant of the corona virus takes a toll on major world economies. Thus, the US remaining bullish throughout Tuesday as seen as one of the reasons that kept Bitcoin prices on the decline.
A bearish Bitcoin has contributed to a broader downturn in the cryptocurrency market with Ethereum (ETH) falling below $1,800, Cardano (ADA) was underpinned at $1.025 and Ripple dropped to $0.51. All other major altcoins including Litecoin (LTC), Binance Coin (BNB) and Polygon all dropped significantly on Tuesday.
It remains unclear where the crypto market is headed from here.
Bitcoin Price Technical Outlook
From a technical outlook, Bitcoin’s price is currently bullish as BTC/USD trades above the $30,000 psychological level around $30,800.
On the 12-hour chart, Bitcoin price recorded a high that is close to the $31,100 support level that has is now acting as resistance. A level that is being traced by a ‘W-shaped’ double top level.
BTC has closed a bullish morning star candle above the $30,000 mark, which is pushing Bitcoin price upwards towards an immediate resistance level at $31,100. A bullish breakout beyond this level could lead the BTC price past the next major resistance level $32,200 to reach levels around $32,500.
Check this guide for more information on crypto signals.
Bitcoin Price (BTC/USD) 12-Hour Chart
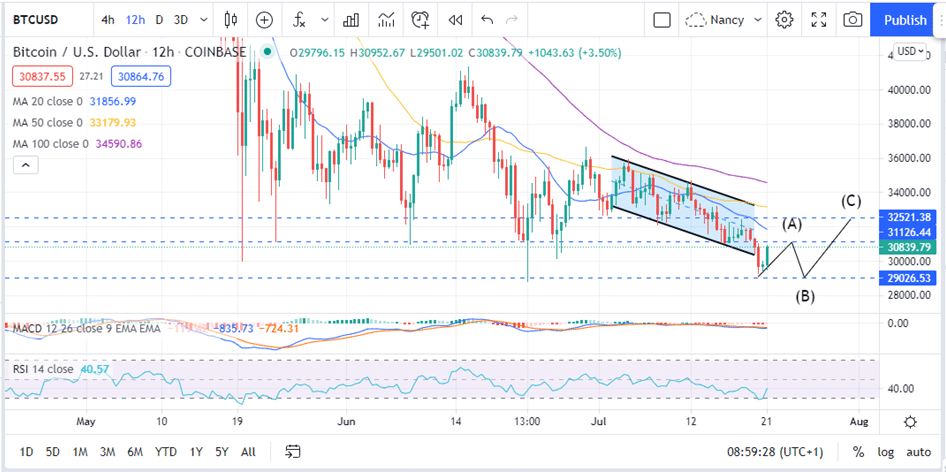
The Relative Strength Index (RSI) accentuates this bullish outlook. This trend following indicator measures the strength of the momentum. It bounced off the 30 mark for a sharp rise away from the oversold region.
This is indication that bullish momentum is strong and that it is likely to continue in the near term.
Read our detailed how to buy cryptocurrency guide if you want to take the plunge.
A look over the Fence
Bitcoin’s price upward swing could be curtailed by the 20-day Simple Moving Average (SMA). BTC has been trading below the 20-day SMA since July 12 and currently placing resistance at around $31,800.
Failure to overcome this hurdle could see Bitcoin go lower towards the $29,000 zone before making any significant recovery upwards.
Looking to buy or trade Bitcoin now? Invest at eToro!
Capital at risk
