- The short-term technical picture implies more selling.
- Recovery path is obstructed with numerous resistance levels.
Bitcoin is sidelined under $3,400 handle which serves as a local resistance that separates the price from the stronger barrier created by the upper line of Bollinger Band (1-hour) at $3,500.
The digital coin No.1 stays under pressure amid strong bearish sentiments on the cryptocurrency markets. It appears that traders focus on uncertainties and negative factors and ignore positive developments. BTC/USD is down over 84% from its all-time peak, though, if history is any guide, it still has a chance for a strong recovery.
Bitcoin’s short-term technical picture
On the intraday charts, BTC/USD stayed below the middle line of Bollinger Band (1-hour chart) and slipped under $3,400. The coin found support at $3,360 created by the lower edge of the above-said Bollinger Band. A sustainable move below will push the price towards $3,300 and to the recent low of $3,211.
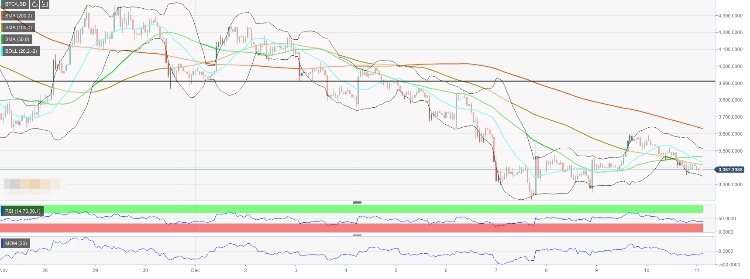
The way to the upside is riddled with technical resistance levels, which include SMA100 at $3,417, the middle line of Bollinger Band at $3,430, SMA50 at $3,460 (all SMAs are 1-hour). Once these barriers are out of the way, the price will bump into $3,500 where new selling interest may appear. However, if it is cleared, the recovery will gather pace with the next focus on $3,600 and $3,630 (SMA200, 1-hour).
BTC/USD, 1-hour chart