- BTC retraces from momentum high.
- Stuck in a long term range.
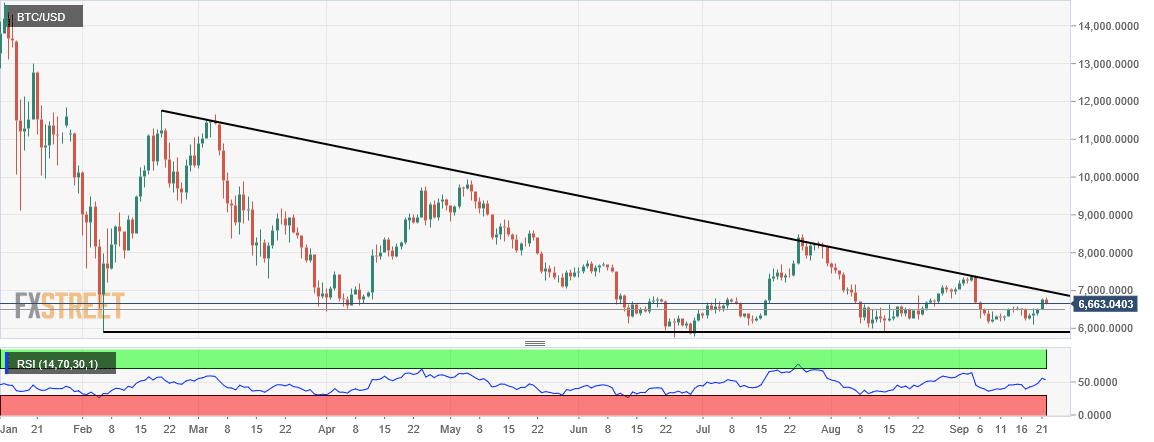
Bitcoin, the largest cryptocurrency by market capitalisation, continues to trade in a tight long term range even after the rally it saw in the last week, as it finds it hard to cross the stiff resistance posed on the long term chart.
BTC/USD is down more than a percent on day at $6,656 after reaching as high as $6,822, thats more than two weeks high. Thats slightly below the descending trendlie resistance on the daily chart, which the crypto King has not been able to close above since February this year.
On the downside, strong support is placed just below the psychologically important $6,000 mark.
BTC/USD daily chart: