- BTC fails to cross key hurdle on the long term chart.
- Move down to $6,000-6,200 likely.
Bitcoin, the defacto King of cryptocurrencies, has been moving at snail’s pace in the range that has not been helping the cause of bulls in any way since last few weeks. End result – ranged trading, of which BTC is now headed towards lower end of the range.
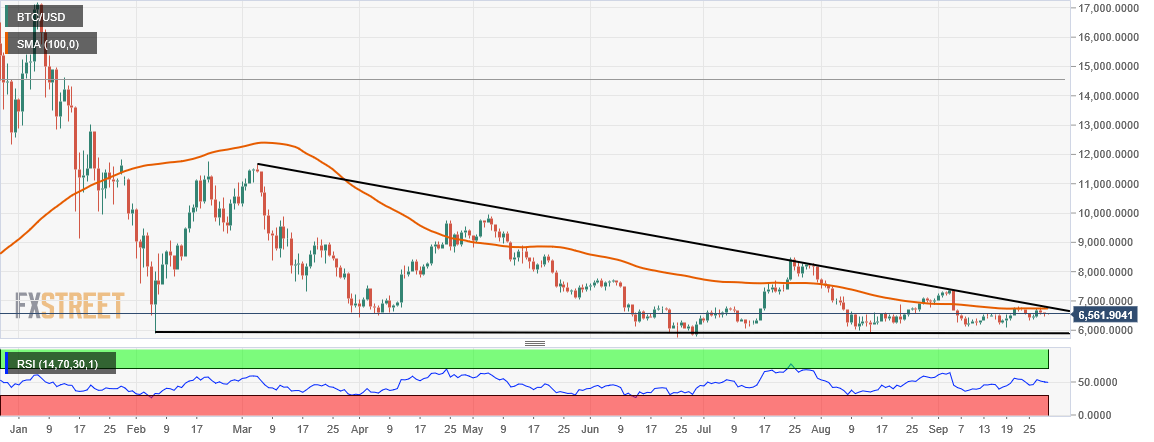
BTC/USD is down 3 cents of a percent on day at $6,564 and in a less than one percent range. On the daily chart, as reported by this author last week (read here), BTC continues to trade in a range and is headed towards lower end of the range after failing to cross past the upper resistance, posed by descending trendline and 100 days SMA.
On the downside, strong support is placed around $6,000-6200 range, which won’t break so easily.
BTC/USD daily chart: