- BTC/USD broke above $3,900 only to bump into $4,000
- The range has changed to $3,900-$4,000.
Bitcoin (BTC) slid to $3,939 low during Asian hours; however the sell-off proved to be temporary as the coin has recovered to $3,960 by the time of writing. BTC/USD managed to break free from a narrow range of the previous week, but $4,000 resistance remains unconquered as of yet.
A breakthrough above $3,900 set the ball rolling and took the price as high as $4,038 on Saturday. However, the momentum petered out quickly as the market needs new triggers to push the price above this barrier.
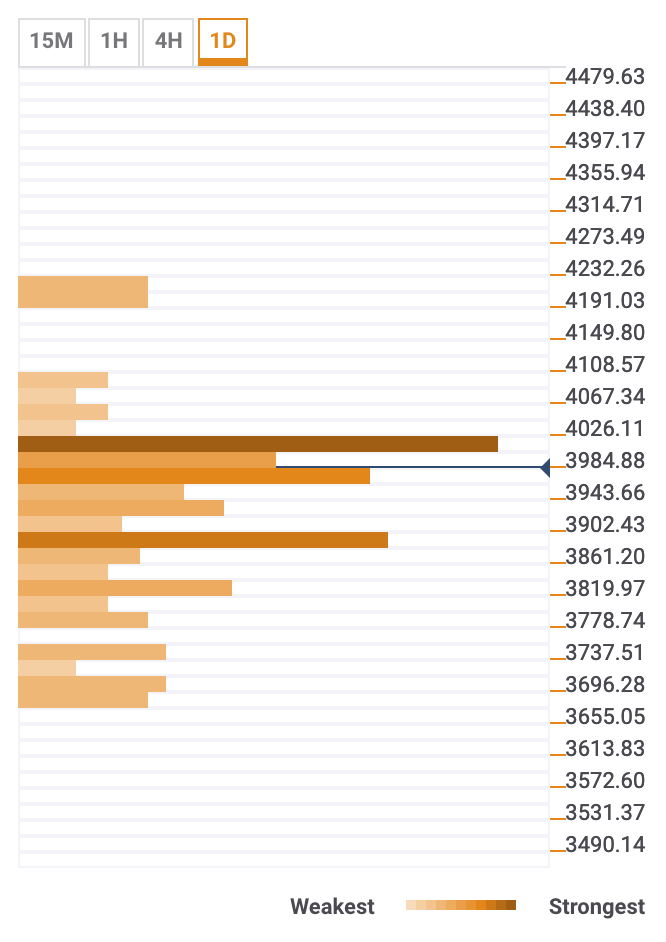
BTC/USD the daily confluence detector
The resistance zone is located above the current price and goes all the way up to $4,030. This area contains a series of significant technical including:
* Midline `and the upper line of Bollinger Band on 1-hour, the upper boundary of a daily Bollinger Band, upper and middle line of 15-min Bollinger Band.
* A series of significant SMA levels including SMA50 1-hour and a host of 15-min SMA levels.
* Fibo retracement levels (23.6% monthly, 61.8% daily)
There are no severe hurdles above this area, which means that a sustainable move higher might trigger a strong upside movement.
Below the current price, the support is created by SMA100 (4-hour), 23.6% Fibo retracement daily, 38.2% Fibo retracement daily, the lower boundary of 1-hour Bollinger Band and midline of 4-hour Bollinger Band. Once the price is below $3,950, the sell-off may continue towards the next aim at $3,900-$3,870. It is created by a confluence of technical indicators including 38.2% Fibo retracement monthly and 61.8% Fibo retracement weekly.
A host of weak support levels spreads until $3,650.
BTC/USD, 1D