Bitcoin price opened the day on Sunday trading in the green bouncing off the horizontal trendline (x-axis) of a descending triangle at around $31,200. This is an attempt by the bulls to reverse the bloodbath that the flagship cryptocurrency has experienced since the all-time high (ATH) in April. These losses tested the zone around $28,800 confirming support at $28,000.
At the time of writing, Bitcoin price hovers around $31,800 on most crypto trading platforms while dealing with overhead pressure beneath the 20-day Simple Moving Average (SMA) and the descending trendline. Holding above $32,000 has become very crucial for the resumption of a recovery. However, the overall technical outlook shows that BTC may drop further in the near term.
Bitcoin Price May Fall Further as $23,200 Beckons
The Bitcoin price 12-hour chart highlights a descending triangle. This technical pattern is usually considered bearish analyse a bearish price action. The descending triangle formed by two trendlines: a descending trendline (hypotenuse) linking a series of lower highs and a horizontal trendline (x-axis) connecting relatively equal lows.
It starts with high volume which contracts as the triangle narrows, highlighting a period of price consolidation. The horizontal trendline shows a strong support, indicating a robust bullish front while hypotenuse shows the gradual pressure exerted by the bears. If BTC breaks below the horizontal trendline, the bearish outlook will be confirmed.
The break out should take place before the trendlines meet and has a target to the distance equal to the triangle’s thickest part. Thus, Bitcoin is likely to dump 25% to test areas around $23,200 before recovery takes place.
Bitcoin Price (BTC/USD) 12-Hour Chart
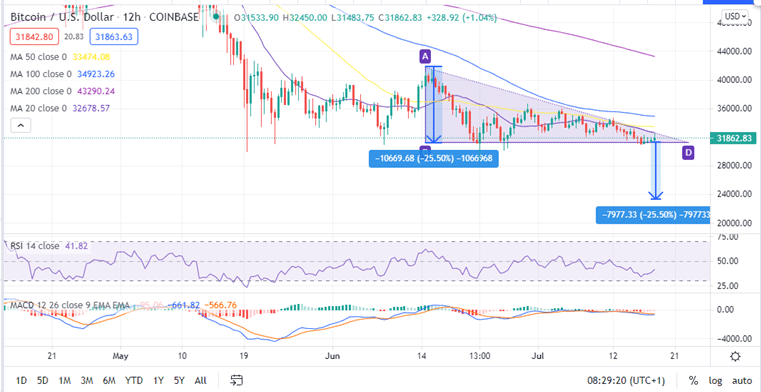
This bearish outlook is accentuated by the Moving Average Convergence Divergence (MACD) indicator, as seen on the same 12-hour chart. BTC’s downtrend will resume as the MACD’s continued movement below the signal line further into the negative zone.
Understand more crypto signals here to know when to take the plunge
Bitcoin Price IOMAP Model Highlights Robust Resistance
The In/Out of the Money Around Price (IOMAP) model, developed by IntoTheBlock adds credence to the bearish outlook. This on-chain metric highlights the robust resistance upwards particularly between $32,868 and $33,814. Here, 966,000 addresses previously bought around 730,000 BTC. Overcoming this obstacle will not be easy for Bitcoin bulls. Therefore, reversing the losses may take a while.
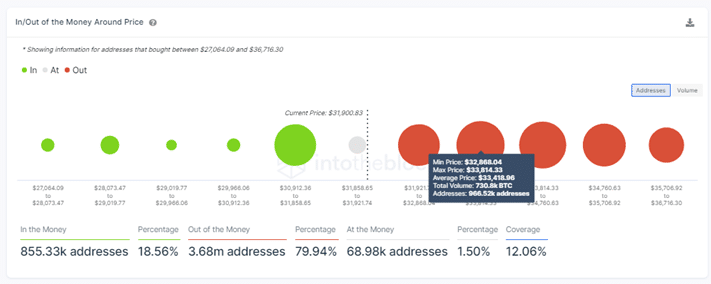
Is There an Upside to the Bitcoin Price?
On the upside, the IOMAP model reveals that bitcoin is sitting on a relatively strong support area between $30,912 and $31,858. Therefore, bulls must defend the current support provided by the horizontal line at $31,200 which falls within this range. Moreover, the green candles that appeared earlier on Sunday show that bulls are taking over. The sharp upward rise by the Relative Strength Indicator (RSI) indicator away from the oversold region indicates the bullish determination to begin a Bitcoin price recovery.
Looking to buy or trade Bitcoin now? Invest at eToro!
Capital at risk
