- BTC/USD bulls stopped within a whisker of $9.400.
- The local support is now created by $9,200.
Bitcoin (BTC) resumed the recovery and tested $9,380 during early Asian hours. While the upside momentum faded away on approach to the local resistance of $9,400, the short-term trend remains bullish as long as the price stays above $9,200. this barrier limited the recovery during the previous week, now it has a strong potential as a backstop for the bears.
BTC/USD 1-hour chart
-637297051382495822.png)
Also, Bitcoin’s on-chain fundamentals are bullish and point to the increased holding patterns and adoption. The index, calculated by the cryptocurrency research company Glassnode, increased by 1 point, reaching a score of 56 points as the market sentiments improved along with the Network Health.
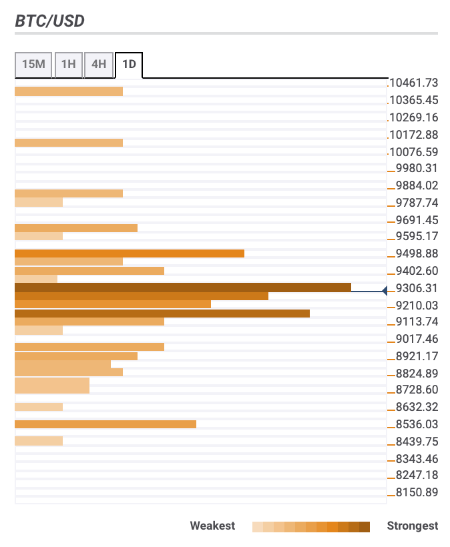
Bitcoin confluence levels
BTC/USD is squeezed between strong technical levels, which means the coin may spend some time before another attempt to develop a directional move. While a breakthrough above $9,200 is a positive short-term signal, the technical picture remains uncertain at this stage as there are quite a few barriers both above and below the current price. Let’s have a closer look at the support and resistance areas.
Resistance levels
$9,300 – 23.6% Fibo retracement daily, the middle line of the 1-hour and daily Bollinger Bands, the highest level of the previous week
$9,500 – Pivot Point 1-week Resistance 1, Pivot Point 1-day Resistance 2
$9,800 – 61.8% Fibo retracement monthly
Support levels
$9,150 – 38.2% Fibo retracement weekly, 1-hour SMA100 and SMA200, 4-hour SMA50
$9,000 – the lower line of the daily Bollinger Band, the lowest level of the previous day
$8,500 – Pivot Point 1-month Support 1, Pivot Point 1-week Support 2.
BTC/USD, 1-day