- BTC/USD eases from intraday top after bouncing off three-week low.
- Falling wedge, corrective pullback from 200-bar SMA favor buyers.
- Bears can eye for early February tops during further weakness.
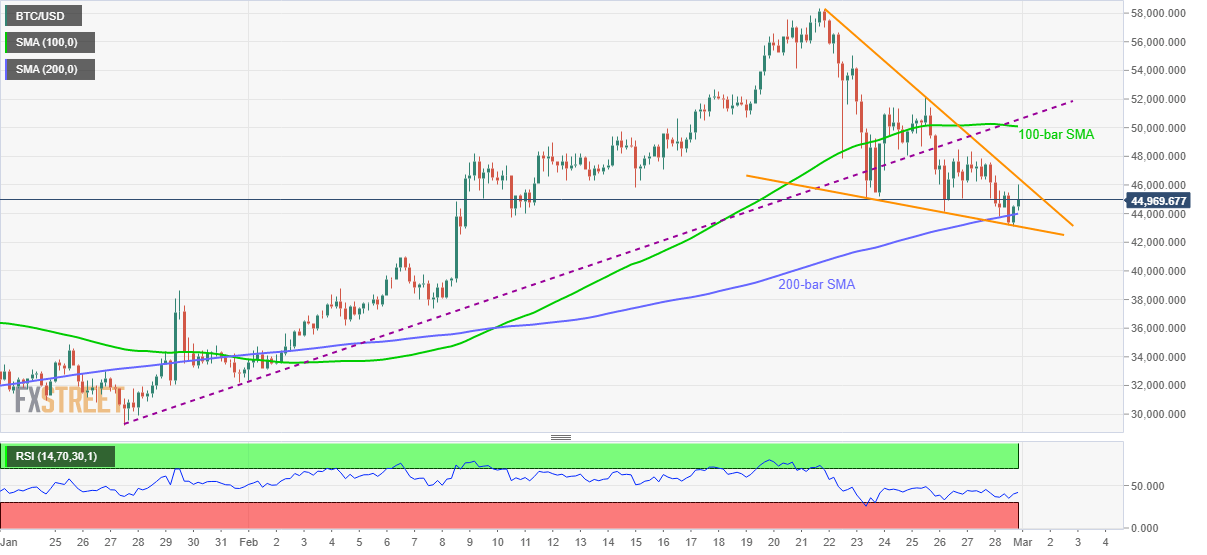
BTC/USD drops from the intraday high near $46,000 to currently around $45,100 during early Monday. Even so, the crypto major keeps bounce off 200-bar SMA, marked during the weekend, while also staying inside a bullish chart pattern on the four-hour play.
Normal RSI conditions also back the BTC/USD towards confirming the short-term falling wedge bullish formation by clearing the $46,500 hurdle.
However, a convergence of 100-bar SMA and previous support line from January 27, near $50,100-400, should test the Bitcoin buyers ahead of directing them to $55,000 during the ultimate ride to refresh the record high of $58,355.
Meanwhile, a downside break of 200-bar SMA, currently around $44,000, needs to defy the bullish chart pattern by declining below $43,100, to extend the BTC/USD south-run towards February 06 high near $41,000.
It should be noted that $42,500 is likely an intermediate halt during the downturn whereas the $40,000 becomes an extra filter to watch.
Overall, BTC/USD bears seem tiring and a bullish chart pattern, coupled with a corrective pullback from the 200-bar SMA, suggests recovery moves.
BTC/USD four-hour chart
Trend: Further recovery expected
