- Bitcoin price trades above the $44,000 psychological level.
- BTC faces Significance resistance upwards posed by the 200-day SMA.
- The recent Bitcoin bullish momentum eyes areas above $50K
Bitcoin price has had three straight bullish sessions as bulls roared back to recuperate losses witnessed earlier this week reaching an intraweek low on Wednesday. Yesterday, Bitcoin reached a high of about $43,500. This is the first time BTC has traded above $43,000 since May 19.
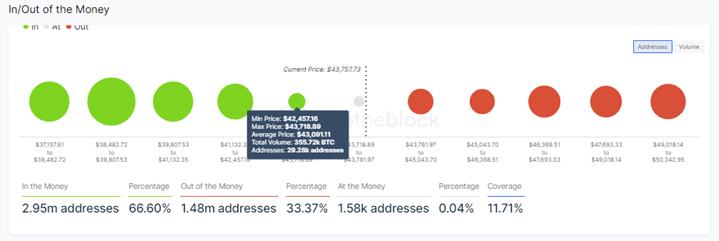
While the news on Google allowing Bitcoin and other cryptocurrency ads may have helped bolster the recent BTC price rise, on-chain metrics indicate that Bitcoin faces significant resistance between $45K and $50K.
Bitcoin Price Rally Eyes $50,000
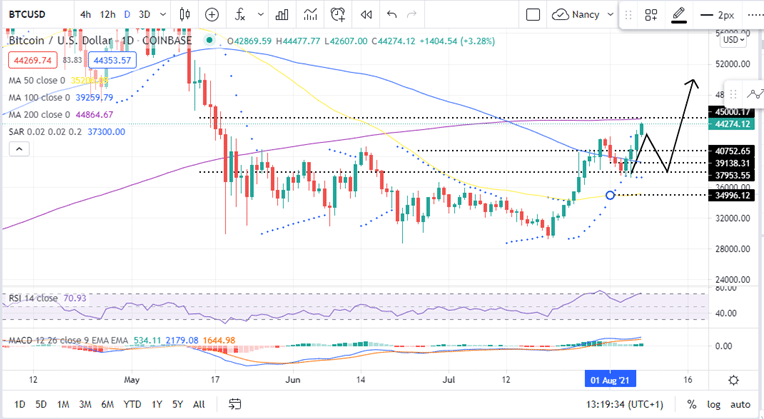
At the time of writing, Bitcoin hovers around $44,274 as bulls tighten their grip on BTC to resume the bullish run that was started on July 21. The price of the largest cryptocurrency by market capitalization rose by almost 14% between August 04 and August 03. Yesterday Bitcoin price reached a high of around $43,400 shattering the $43,000 psychological level.
On the daily chart, the pioneer cryptocurrency is battling immediate resistance presented by the $200-day simple Moving Average at the $45,000 level. Note that a daily closure above this level could bolster Bitcoin price bulls towards the $50,000 psychological level.
However, the BTC will have to overcome the $46,000 psychological level, resistance at $46,761, and the $48,000 psychological level before making a go at $50,000.
Bitcoin price prediction following the Relative Strength Index (RSI) and the Moving Average Convergence Divergence (MACD) indicate BTC is generally bullish. The RSI’s upward movement into the oversold area shows the bullish momentum is strong.
Moreover, the MACD’s position above the zero line in the positive region as well as its movement above the signal line accentuates the bullish narrative.
BTC/USD Daily Chart
Moreover the In/Out of the Money Around Price (IOMAP) model by IntoTheBlock shows that BTC faces massive resistance between $45,000 and $50,000. The same IOMAP model show that Bitcoins immediate support around $42,700 is relatively week. It sits within the $42,457 and $43,718 price range where only 29,000 addresses are holding 355,000 BTC. This support is not robust enough to absorb any selling pressure that might ensue.
BTC Could Reach These Levels
On the downside, failure to close the day above the $200-day SMA at $45,000 could see BTC take a breather and retract to test the immediate support at $42,700 before the bulls re-group to take Bitcoin Price higher again.
Any further drop would see the Bitcoin price retreat towards the 100-day SMA at $39,100 and 50-day SMA at $35,000 respectively.
- If you are looking to trade Bitcoin using crypto robots, this guide might be useful.
Looking to buy or trade crypto now? Invest at eToro!
Capital at risk


