- BTC/USD struggles to extend recovery moves from 21-day SMA, one-month-old support line.
- 10-day SMA, bearish MACD probes the Bitcoin buyers.
- February 10 low adds to the downside filters.
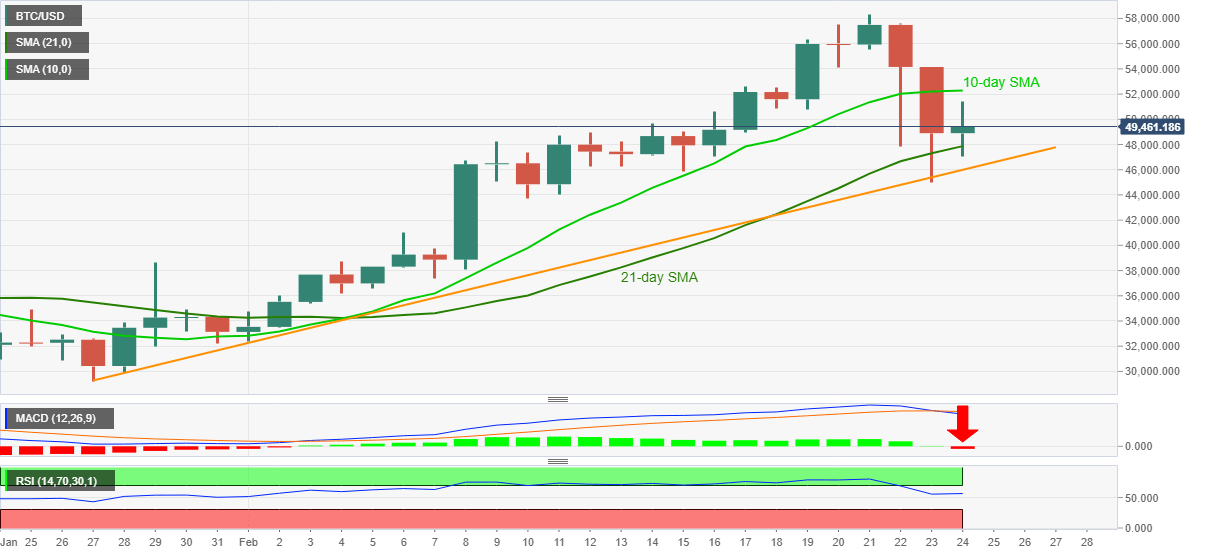
BTC/USD takes the bids near $49,450 while extending the previous day’s recovery moves during the early Thursday’s trading. The quote rose for the first time in the last two days on Wednesday following its bounce-off key support indicators, namely the 21-day SMA and an upward sloping trend line from January 27.
Even so, MACD flashes the strongest bearish signals in February while 10-SMA, currently around, also probes the buyers targeting the $50,000 immediate hurdle.
In a case where the Bitcoin buyers manage to cross $52,300 SMA resistance, the recent record top near $58,355 and the $60,000 will be on their radars.
Alternatively, 21-day SMA and the stated support line, respectively around $48,000 and $46,000, could restrict the quote’s short-term pullback moves.
However, any further weakness below $46,000 will not hesitate to challenge the February 10 low near $43,700, a break of which will eye for the early month top near $41,000 and the $40,000 threshold afterward.
Overall, Bitcoin is still under threat of a pullback unless clearing immediate resistances stated above.
BTC/USD daily chart
Trend: Bullish
