- BTC is currently trading at $12,759 after slipping below a critical support level in the short-term.
- It seems that Bitcoin is facing a correction period in the upcoming days.
Bitcoin had a major breakout towards $13,000, cracking this psychological level and climbing as high as $13,245 on some exchanges. Many analysts expected the flagship cryptocurrency to have a slight correction period before returning to its bullish uptrend.
Bitcoin drops below $12,800 and losses crucial support level
On the 1-hour chart, Bitcoin’s price was trading above the 50-SMA, keeping it as a support level; however, in the past hour, bears have managed to push BTC below this point and broken another crucial support level.
BTC/USD 1-hour chart
-637390686800647201.png)
The Bollinger Bands were squeezed, indicating that a major price move was underway. The lower band was also acting as a healthy support level. However, the recent bearish breakout could drive BTC down to $12,500 where the 100-SMA is located and as low as $12,000, a vital psychological support level.
The bullish side of things
Despite the recent correction and bearish breakout, the overall momentum of Bitcoin remains bullish. The flagship cryptocurrency needs to climb back above the lower Bollinger band and the 50-SMA and turn it into a support level again.
BTC IOMAP Chart
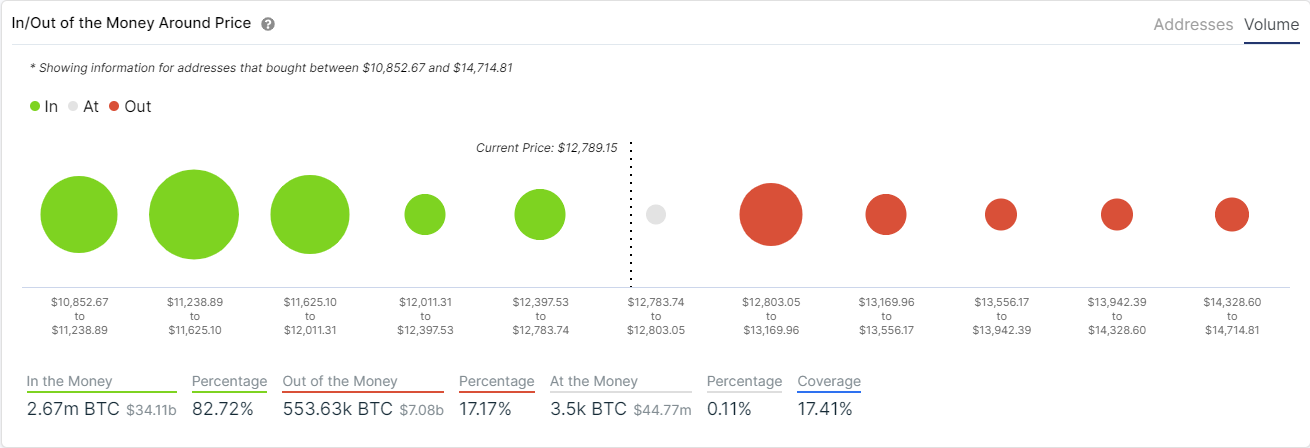
The In/Out of the Money Around Price chart continues showing very little resistance to the upside. The most significant resistance area seems to be contained between $12,803 and $13,169. A breakout above this point can easily push BTC up to $14,000.
