- This current sideways trading is likely to continue taking center stage throughout this week.
- After the stability, a breakout is expected to send the price above $4,000 and push it towards $4,200.
The cryptocurrencies market has been avoiding big movements either side since the previous slide that sent Bitcoin back below $4,000. Prior to the drop, the largest cryptocurrency by market capitalization had formed a 4-week high around $4,057. The 4-hour chart shows that bear pressure is canceling out the bullish pressure. This current sideways trading is likely to continue taking center stage throughout this week unless Bitcoin encounters a market mover (catalyst).
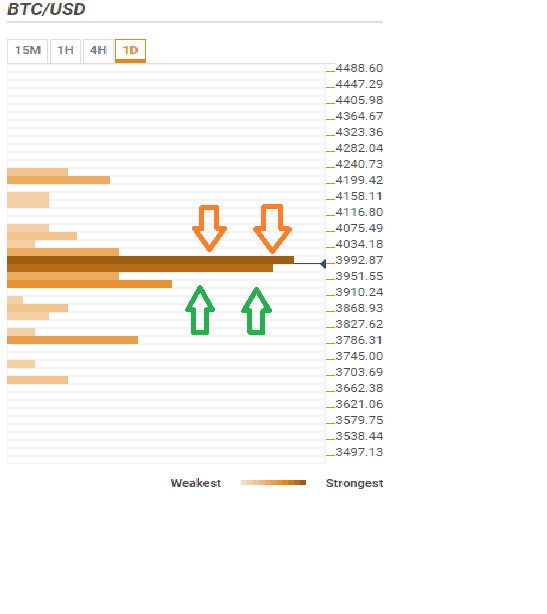
According to the confluence detector tool, BTC/USD must clear the significant resistance at $3,992.97. This zone is highlighted by a confluence of indicators including the previous high 15′, previous high 1-hour, Bollinger Band 15′ upper, previous high 4-hour, Bollinger Band 4-hour Middle, 10 SMA daily, Bollinger Band 1-hour upper, 200 SMA 1-hour, 100 SMA 1-hour. 50 SMA 4-hour, previous high daily, Bollinger Band 4-hour upper, pivot point daily R2, 61.8% Fib level weekly and the 161.8% daily.
If Bitcoin manages to clear this level, a breakout is expected to send the price above $4,000 and push it towards $4,200.
On the downside, various support areas have been established to prevent the digital asset from trimming its value in the event declines progress. Initial support is seen at $3,951 and is host to the 100 SMA 4-hour, previous low daily, pivot point daily S1 and the 23.6% Fib retracement level weekly. Other support levels are $3,786.31 and $3,703.69.