- BTC/USD went up from $9,600 to $9,697 in the early hours of Wednesday.
- Daily confluence detector shows two prominent support levels.
BTC/USD went up from $9,600 to $9,697 in the early hours of Wednesday, stringing along two bullish days in a row. The hourly breakdown shows that BTC/USD attempted to breach $9,700 before, but it met resistance and fell to $9,540. The bulls gained momentum and again went up to the $9,700. If the bulls continue to have a hold on the market, they can re-enter the $10,000 zone.
BTC/USD daily confluence detector
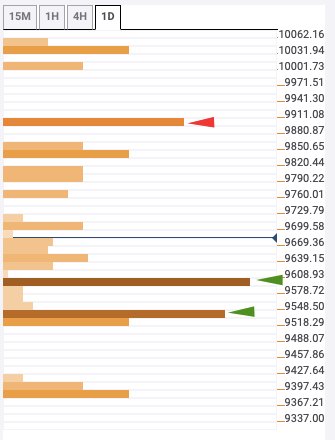
There is a prominent resistance level at $9,900, which has the monthly Fibonacci 61.8% retracement level. On the downside, the two healthiest support levels are at $9,525 and $9,600. The $9,525 level has a confluence of 4-hour Bollinger band middle curve, 4-hour previous low, 15-min Bollinger band lower curve, 10-day simple moving average (SMA 10) and daily Fibonacci 61.8% retracement level. The $9,600 level has the SMA 5 and SMA 100 curves.
