- Bitcoin price breakout above a falling wedge pattern catapults the price to weekly highs close to $9,800.
- PayPal is rumored to be preparing to integrate cryptocurrency payments according to the latest job listings.
- Bitcoin holds above $9,600 in favor of consolidation before gains towards $10,000 are enacted once again.
Bitcoin bulls are hoping to reap from their effort of keeping the price above $9,600 following a retreat from weekly highs at $9,787.40. The gains in the last 24 hours are attributed to rumors that PayPal was getting ready to integrate cryptocurrency. As reported by FXStreet, PayPal is hiring two blockchain engineers who will be involved in research and technical developments.
BTC/USD also broke above a falling wedge pattern breakout as observed on the daily chart below. The breakout happened at the right time and took advantage of the volume brought about by PayPal rumors. Several resistance areas were shattered including $9,600 and $9,700. Although the bulls’ eyes were fixated on breaking above the psychological $10,000 level, the momentum lost steam short of $10,000.
At the time of writing, Bitcoin is exchanging hands at $9,630. The shallow retreat from the weekly highs is likely to seek balance before another attempt is made on climbing above $10,000. The region at $9,600 was last week’s key resistance, therefore, support is likely to hold. Glancing upwards, a break above $9,800 would catapult Bitcoin towards $10,000.
From a technical perspective, Bitcoin is facing increased selling activity, especially in the current session. The RSI is pointing south after failing to sustain action above 60. If the downward movement towards 50 continues, there is a chance that Bitcoin would drop under $9,600.
Meanwhile, the MACD shows that losses are unlikely to come into the picture in the short term. The indicator is moving sidelong at the midline. If consolidation takes over in the short term, it will give the bulls the ability to focus on pushing the price upwards.
BTC/USD daily chart
-637284884829271614.png)
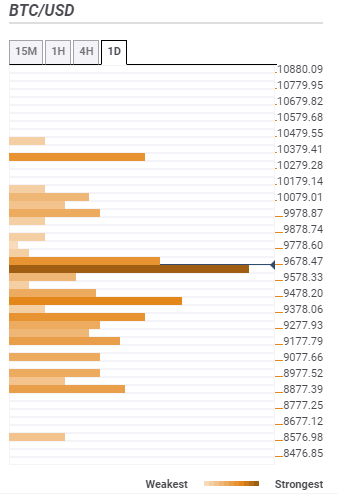
Bitcoin resistance and support areas
Resistance one: $9,678.47 – Highlighted by the Bollinger Band 4-hour upper, the pivot point one-week resistance one, the previous high 15-minutes, the SMA 50 15-minutes and the SMA five 1-hour.
Resistance two: $9,978.87 – Home to the Bollinger Band one-day upper, the pivot point one-week resistance two and the Fibonacci 161.8% one-week.
Support one: $9,578 – Highlighted by the SMA 100 15-minutes, the Bollinger Band one-day middle curve, the SMA five 4-hour and the Bollinger Band 1-hour middle curve.
Support two: $9,478 – Home to the SMA 200 4-hour, SMA 200 15-minutes, SMA 50 1-hour and the Fibo 61.8% one-day.