- Bitcoin hits a critical barrier at $11,800 delaying the push for gains above $12,000.
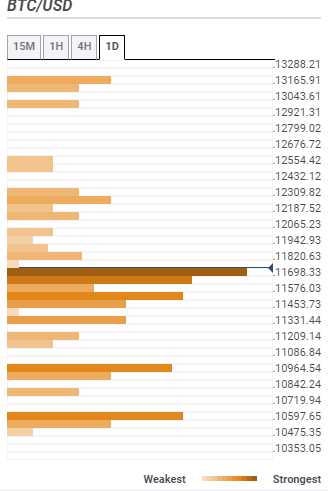
- BTC/USD embraces confluence support at $11,698 signaling a possible consolidation.
Bitcoin recovered significantly over on Thursday after resting the support at $11,100 levels earlier in the week. Initially, there was a struggle in the range between $11,500 and $11,600. However, buyers eventually gathered the strength to push for gains towards $12,000. Although all the attention effort was channeled towards breaking the resistance at $12,000, Bitcoin hit a barrier at $11,800.
Meanwhile, BTC/USD is exchanging hands at $11,768 in the wake of a minor retreat. The bearish leg has traded intraday lows of $11,686. The push for gains above $12,000 may have taken a hit but make no mistake, the bulls are unrelenting in this mission.
Moreover, the technical picture has remained positive in spite of the barrier at $11,800 and the retreat. The RSI, for instance, is clinging tightly to the level at 70 after a rigorous recovery from 60 (August low). A glance at the MACD clearly shows that consolidation would take place ahead of the expected breakout above the psychological $12,000 resistance.
If we take a wider look at the BTC/USD daily chart, then the price has been in consolidation between $11,000 (main support) and $12,000 (resistance). For now, bringing down the selling pressure is top on the bulls’ priority list.
BTC/USD daily chart
Bitcoin confluence resistance and support levels
Resistance one: $11,820 – This the first resistance according to the confluence tool. It is highlighted by the previous high 1-hour, previous high 15-minutes, the Bollinger Band 15-minutes middle and the previous high one-day.
Resistance two: $11,942 – A minor seller congestion likely to delay price action to $12,000. It is highlighted by the Bollinger Band 4-upper curve.
Resistance three: $12,065 – This is the first hurdle buyers would encounter in the run above $12,000. It is home to the pivot point one-day resistance one.
Support one: $11,698 – The strongest buyer congestion zone highlighted by the SMA 100 1-hour, SMA 50 15-minutes, the Fibonacci 23.6% one-day, the previous low 1-hour and the previous low 4-hour.
Support two: $11,576 – The second most significant support zone and home to the Fibonacci 61.8% own-week, the SMA 200 15-minutes and the SMA 50 1-hour.
Support three: $11,331 – Home to the previous low one-day, the Bollinger Band 4-hour and the Bollinger Band one-day middle.
%20(23)-637329784998514298.png)

