- BTC/USD bulls and bears canceled each other out and ended Thursday around $8,588.
- One healthy support level lies at $8,495, as per the daily confluence detector.
BTC/USD has gone down from $8,589 to $8,560 so far today. The bulls and bears canceled each other out this Thursday as the price trended horizontally and ended around $8,588. The hourly BTC/USD chart shows us intraday resistance lies at $8,624.25, while the support is at $8,491.45. While the buyers and sellers have are effectively in a standstill, the daily confluence detector shows us that if the $8,600 resistance level is overcome, the price may spike up into the $9,000 zone.
BTC/USD daily confluence detector
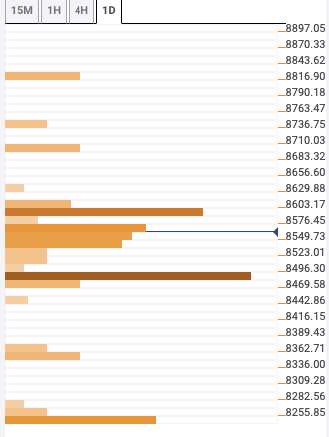
The $8,600 resistance level has the one-day Bollinger Band middle curve, 15-min Previous High, one-hour Previous High, four-hour Previous High and 15-min Bollinger Band upper curve.
On the downside, the strongest support level is at $8,495. It has the one-month Fibonacci 23.6% retracement level and one-day Fibonacci 38.2% retracement level.
