- The daily confluence detector shows one healthy support level at $10,075.
- BTC/USD has gone down from $10,110 to $10,092.
The hourly BTC/USD price chart shows us that the price dropped from $10,130 to $9,815 this Thursday. The bulls then gathered momentum before it picked up to $10,190, meeting resistance. Since then, BTC/USD has been on a continuous downtrend and is currently trending around $10,092.
BTC/USD daily confluence detector
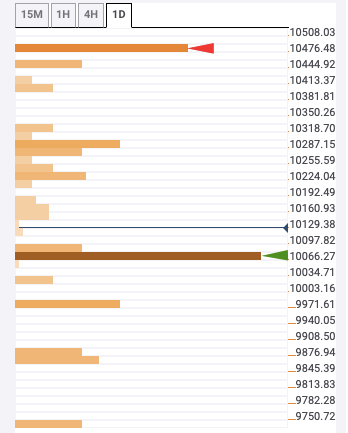
The daily confluence detector shows only one prominent resistance and support level. The $10,500 resistance level has the 5-day simple moving average (SMA 5) curve. The $10,075 support level has the 1-month 23.6% Fibonacci retracement level, SMA 10, 1-hour Bollinger band middle curve and 4-hour previous low.
