- BTC/USD bulls take a breath after the recent sharp movements.
- The local resistance levels come at $11,350 and $11.450.
Bitcoin (BTC) settled above $11,000, however, the further recovery is limited by the local resistance of $11,300. This barrier is reinforced by the middle line of the 1-hour Bollinger Band. The first has stayed mostly unchanged both on a day-to-day basis and since the beginning of Tuesday, while its market capitalization settled at $208 billion. At the time of writing, BTC/USD is trading at $11,250 amid a short-term bullish trend. The coin’s market dominance dropped to 60.4% as some major atcoins, including Ethereum, are doing much better.
BTC/USD 1-hour chart
-637321292285574408.png)
On the intraday charts, BTC/USD stays above 1-hour SMA50 at $11,230, which now serves as a local support area. Once it is out of the way, the sell-off is likely to gain traction with the next focus on1-hour SMA100 at $11,150 and the psychological $11,000. This barrier may slow down the bears and create a new bullish momentum.
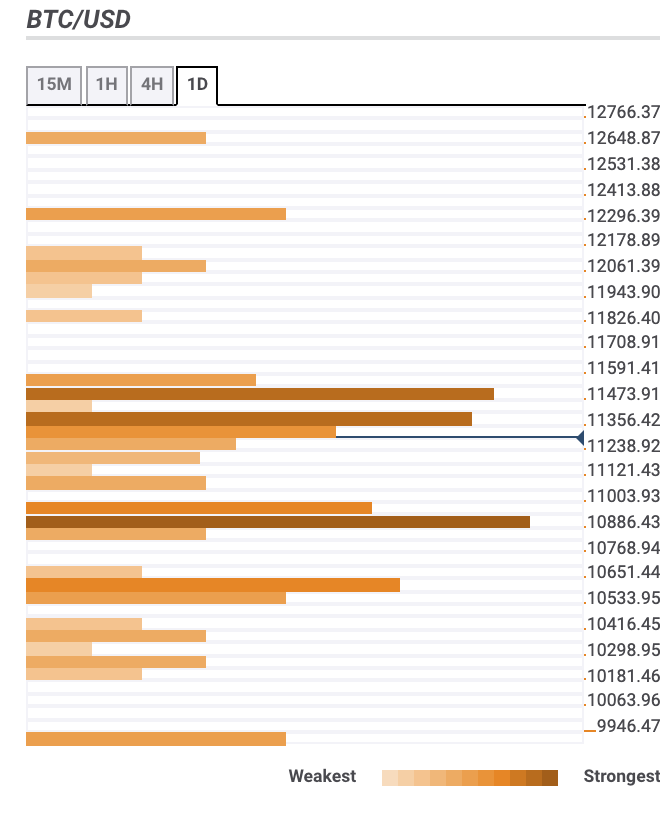
Bitcoin confluence levels
There are several important technical barriers below and above the current price. It means that BTC/USD may spend some time consolidating gains at the current levels; however, in the long-run, the trend stays bullish as long as the price is above $11,000. Let’s have a closer look at the support and resistance levels.
Resistance levels
$11,350 – 1-hour SMA100, 23.6% Fibo retracement daily
$11,440 – the highest level of the previous week and month, the upper line of the 1-hour Bollinger Band
$12,000 – the upper line of the daily Bollinger Band, Pivot Point 1-week Resistance 1
Support levels
$11,000 – 23.6% Fibo retracement weekly
$10,850 – 23.6% Fibo retracement monthly, the lower line of the 4-hour Bollinger Band
$10,500 – 161.8% Fibo retracement daily
BTC/USD, 1-day